
What are the 4 stages of analytics maturity and which stage is your business in?
Discover the 4 stages of the analytics maturity model. Discover if your business is in the descriptive, diagnostic, predictive, or prescriptive stage today.
BUSINESS INTELLIGENCE
Key Points
The analytics maturity model shows how businesses evolve from basic reporting to AI driven decision making
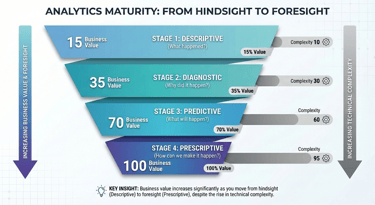
There are four stages of analytics maturity: descriptive, diagnostic, predictive, and prescriptive
Descriptive analytics focuses on understanding what happened using historical reports and dashboards
Diagnostic analytics explains why results happened by drilling into data and finding root causes
Predictive analytics uses statistics and machine learning to forecast future outcomes and risks
Prescriptive analytics uses AI and automation to recommend or take the best actions automatically
Actionable takeaway: Audit your current data usage, identify your maturity stage, and start by centralizing and cleaning your data to move to the next level
What is an analytics maturity model and why does it matter?
An analytics maturity model is a tool that measures how well your company uses data. It is a ladder with four steps. As you climb higher, your data becomes more valuable. It stops being a list of numbers and becomes a strategic weapon.
In the modern market, speed is everything. Businesses that use advanced analytics can react faster than those that do not. According to McKinsey, 84% of companies in the GCC region have already started adopting AI in at least one business function. However, only 31% have successfully scaled these tools. This shows that while many are starting the journey, few have reached the top.
Stage 1: What is descriptive analytics?
This is the most basic level of analytics. It answers the simple question: "What happened?" Most businesses start here. They use historical data to look at the past.
What are some examples of descriptive analytics?
A common example is a monthly sales report. You might look at your total revenue from last month. You could also track how many new customers you gained in Cairo. This stage uses standard dashboards and simple charts. It helps you see the current health of your business. While it is useful, it only tells you about the past. It does not help you plan for what is coming.
Stage 2: What is diagnostic analytics?
The second stage moves from "what" to "why." It answers the question: "Why did it happen?" This stage helps you find the root cause of your business results.
How do you find the root cause of a problem?
Diagnostic analytics uses "drill-down" techniques. If your sales in Riyadh dropped by 10%, you can use data to find out why. Maybe a specific product was out of stock. Or perhaps a marketing campaign did not perform well. By looking at the details, you can stop guessing. You start making decisions based on facts. This stage requires more interactive Business Intelligence (BI) solutions.
Stage 3: What is predictive analytics?
This stage looks into the future. It answers the question: "What is likely to happen next?" It uses statistics and machine learning to find patterns that humans might miss.
Is predictive analytics becoming more common?
Yes, it is growing very fast. The global predictive analytics market is expected to reach over $21 billion by 2026. In Egypt, companies use this to predict customer behavior. For example, a bank might predict which customers are likely to leave. They can then offer them a special deal to stay. Predictive tools help you prepare for challenges before they arrive.
Stage 4: What is prescriptive analytics?
This is the highest level of maturity. It answers the question: "How can we make it happen?" It does not just predict the future. It tells you exactly what to do to get the best result.
Can AI agents really make business decisions?
Prescriptive analytics often uses AI and automation. Gartner predicts that by 2027, 50% of business decisions will be augmented or automated by AI agents. An AI agent might see a supply chain delay and automatically order parts from a different supplier. This stage removes human error and makes your business incredibly efficient.
Which stage of analytics maturity is your business in right now?
To find your level, look at how you use your data every day. Each stage has clear signs.
Are you in Stage 1 (Descriptive)?
You are in Stage 1 if you rely on static reports. You mostly look at what happened last week or last month. Your data stays in separate spreadsheets. If someone asks "how much did we sell?", you can answer quickly. But if they ask "why?", you have to spend hours searching for the answer.
Are you in Stage 2 (Diagnostic)?
You have reached Stage 2 if you have interactive dashboards. You can click on a chart to see more details. You can compare different regions or products easily. You spend your time looking for trends and finding the "why" behind your numbers. You are starting to connect different parts of your business data.
Are you in Stage 3 (Predictive)?
You are in Stage 3 if you use data to forecast. You might have a model that tells you how much stock you will need next month. You use machine learning to score leads or predict sales. Your business is no longer just reacting to the past. You are actively planning for the future based on data patterns.
Are you in Stage 4 (Prescriptive)?
You have reached the top if your data tells you what to do. You use AI to optimize your prices or your delivery routes. Your systems might even take actions on their own. For example, an automated system might adjust your ad spend based on real-time performance. This is the goal for every modern, data-driven company.
What are the biggest challenges in moving to the next stage?
Moving up the ladder is not always easy. Many companies face a "talent gap." They do not have enough people who know how to manage complex data. Another big issue is poor data quality. If your data is messy, your predictions will be wrong. IBM notes that as AI investment grows, the cost of bad data becomes much higher. This is why many businesses in the MENA region work with experts to clean their data first.
How can you start moving up the ladder today?
The first step is a data audit. Look at what data you have and where it is stored. Most companies find that their data is "siloed" in different apps. You need to bring it all together. Once your data is in one place, you can start building better visuals. As you get more comfortable with basic reports, you can slowly add AI and predictive tools.

How Exology Helps
Exology helps businesses in Egypt, the MENA region, and across the globe turn raw data into a powerful asset. We provide the expertise you need to climb the analytics maturity ladder quickly and safely. Our team specializes in making data work for you, not the other way around.
Business Intelligence Solutions: We build custom dashboards that take you from basic reporting to deep diagnostic insights.
Data Analytics & Visualization: We turn your raw rows of data into intuitive visuals that reveal the "why" behind your business results.
AI and Automation Solutions: Our experts deploy AI agents that move you into prescriptive analytics, allowing you to automate complex decisions.
We have a proven track record of delivering high-impact results:
Exology has delivered over 150 projects worldwide, helping companies of all sizes reach their data goals.
Exology has been able to save our client $130k in one day by using advanced analytics to find and fix hidden leaks.
We saved over 5,000 hours of manual work in 2025 for our clients by replacing manual spreadsheets with automated BI systems.
Read More
Contact us
Whether you have a request, a query, or want to work with us, use the form below to get in touch with our team.