
BI for COOs: Real-Time Operational Visibility
Learn how COO Business intelligence dashboards deliver real-time operational visibility, improve decision-making, and drive efficiency for leaders in Egypt, MENA, and beyond.
BUSINESS INTELLIGENCE
Key Points
COOs need real-time operational visibility to make fast, accurate decisions and avoid reacting to outdated reports.
COO dashboards unify data from ERP, CRM, supply chain, finance, and workforce systems into one real-time view.
Real-time dashboards enable proactive management by detecting bottlenecks and risks early.
Operational intelligence improves cross-functional alignment by giving teams a shared view of performance.
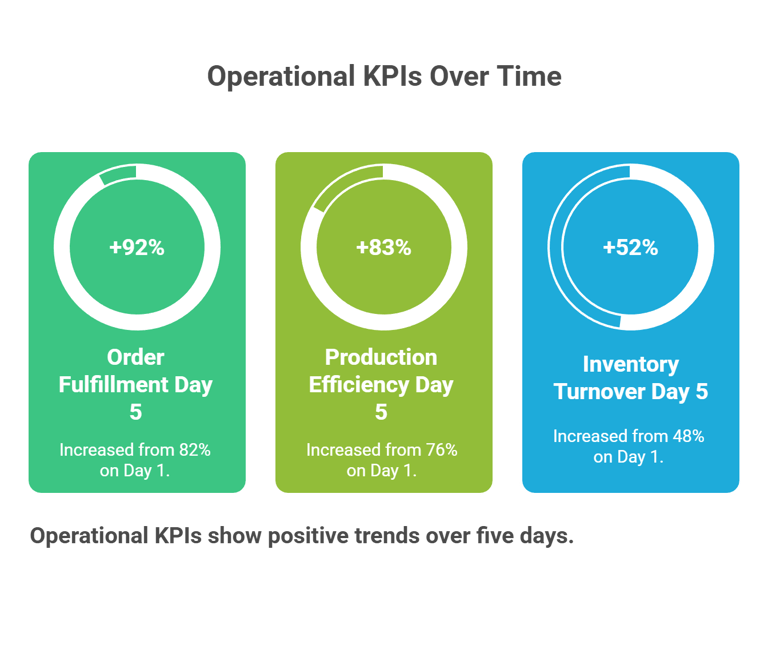
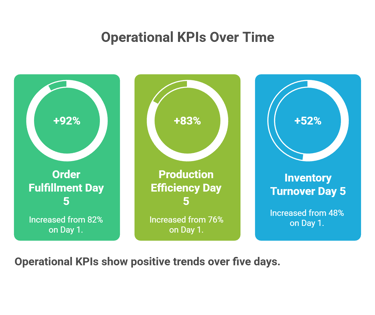
Effective COO dashboards focus on critical KPIs like fulfillment rates, cycle time, inventory, utilization, and productivity.
Successful implementation requires clear KPIs, integrated data sources, strong data quality, and user-focused design.
Actionable takeaway: Identify 5 to 7 core operational KPIs and track them in a real-time dashboard to spot issues and act immediately.
Why COOs Need Real-Time Operational Visibility
A Chief Operating Officer is responsible for managing daily operations, coordinating teams, and ensuring resources are aligned with organizational goals. COOs must make fast, accurate decisions that balance cost, quality, and service delivery. Traditional reporting that updates weekly or monthly cannot keep pace with the speed of modern business environments. Static reports often leave leaders reacting to issues instead of preventing them. Real-time operational visibility gives COOs a continuous line of sight into how key processes are performing at any moment, transforming decision-making and operational health.
Without real-time dashboards, COOs face several challenges: delayed information flow, difficulty identifying bottlenecks early, and slower response to operational risks. Decisions based on outdated reports can lead to inefficiencies, lost revenue, and customer dissatisfaction. In dynamic markets, leaders need information as close to real time as possible to avoid costly delays.
Real-time visibility moves leadership from reactive to proactive management. Instead of waiting for a weekly report to flag issues, COOs can intervene immediately when a KPI drifts out of acceptable range. This shift is essential for maintaining operational agility and sustaining growth in competitive environments.
What Are COO Dashboards and How Do They Work?
COO dashboards are specialized business intelligence tools designed to give operational leaders instant access to the most critical data impacting daily business performance. They aggregate and visualize data from multiple systems, such as ERP, CRM, supply chain tools, finance platforms, and workforce systems into a unified, interactive view.
Definitions and Core Components
At their core, COO dashboards are operational dashboards that provide real-time monitoring of business performance. They display key performance indicators (KPIs), such as production throughput, order fulfillment rates, inventory levels, workforce efficiency, and cost metrics. Data is updated automatically, with minimal latency, so leaders always see the most current status of operations.
Key components include:
Data Integration: Connecting disparate systems into a single platform.
Visual Interfaces: Charts, gauges, and trend lines that make data easy to interpret.
Alerting Mechanisms: Automated notifications when KPIs cross predefined thresholds.
Interactive Filters: Options to slice data by time, region, or department.
How Dashboards Pull Data
Dashboards work by ingesting event streams and transactional data from operational applications. Modern systems can process this data in near real time, displaying updates automatically as business events occur. This capability is often called real-time business intelligence and supports decision-making as soon as data is generated.
Benefits of Real-Time Dashboards for Operations
Real-time dashboards transform raw data into operational intelligence that leaders can act on immediately. Below are core benefits that COOs derive from adopting this technology:
Faster, Informed Decision-Making
Dashboards eliminate delays inherent in static reporting. When a metric shifts unexpectedly, COOs can investigate and respond within minutes rather than days. This responsiveness is crucial for managing rapid changes in demand, production issues, or supply chain disruptions.
Early Detection of Operational Bottlenecks
With live data, COOs can spot bottlenecks before they escalate into larger problems. For example, a sudden drop in production efficiency or spike in defect rates appears instantly on a dashboard, allowing corrective action before service levels suffer.
Enhanced Cross-Functional Alignment
Dashboards provide a shared view of performance across teams. Operations, finance, and supply chain functions can see the same data, enabling coordinated actions and eliminating silos. This shared visibility supports faster alignment on priorities and more effective resource allocation.
Continuous Operational Monitoring
Instead of periodic snapshots, real-time dashboards function like a health monitor for the business. Leaders can continuously observe what is happening right now, giving them an edge in managing both routine operations and unexpected events.
What Metrics COOs Should Track on Dashboards
Effective COO dashboards focus on operational metrics that reflect performance, efficiency, and customer outcomes. Some key metrics include:
Order Fulfillment Rate: Percentage of customer orders delivered on time and in full.
Production Cycle Time: Time taken to complete a manufacturing process.
Inventory Turnover: Frequency at which inventory is sold and replaced.
Machine Utilization: Percentage of operational equipment actually in use.
On-Time Delivery Rate: The rate at which deliveries meet promised timelines.
Employee Productivity: Output per worker over a relevant period.
Tracking these KPIs in real time helps COOs quickly assess whether operations are performing as expected and take action when necessary. Historical comparisons of these metrics also reveal trends that drive strategic improvements.
How to Implement COO Dashboards Effectively
Implementing a dashboard that genuinely empowers a COO requires more than installing software. It involves careful planning, data governance, and user-focused design.
Step 1: Define Key Operational KPIs
Start by identifying the most important indicators for your business. Avoid overloading dashboards with too many metrics; focus on those that drive decisions and reflect performance at a glance.
Step 2: Integrate Data Sources
Connect systems such as ERP, CRM, HR, and logistics tools to create a unified data repository. Data integration eliminates silos and ensures dashboards present a complete picture of operations.
Step 3: Ensure Data Quality and Consistency
Accurate dashboards depend on clean, consistent data. Regularly audit data pipelines and update processes to maintain reliability. Data accuracy builds trust among users and drives dashboard adoption.
Step 4: Customize Dashboard Views
Dashboards should reflect role-specific needs. A COO may require different views than a plant manager or supply chain lead. Tailored dashboards ensure each user sees what they need without distraction.
Step 5: Promote Adoption Through Training
Provide training sessions so users understand how to interpret dashboards and take action. Adoption increases when teams see real benefits in day-to-day decision-making.
Common Mistakes to Avoid with COO Dashboards
Overloading with Irrelevant Data
Too many metrics can overwhelm users and cloud decision-making. Prioritize clarity over quantity.
Ignoring Data Governance
Poor data governance leads to inconsistent metrics and mistrust in dashboard insights. Establish clear definitions and ownership for each data element.
Neglecting User Feedback
Dashboards should evolve with business needs. Regularly gather feedback and refine dashboards to keep them aligned with user priorities.
How Exology Helps
We design custom COO dashboards that integrate data from all core systems to deliver real-time operational visibility.
Our Business Intelligence as a Service BIaaS model ensures dashboards remain updated, accurate, and aligned with evolving business needs.
We help define and prioritize the most impactful operational KPIs for your organization.
Through data analytics and visualization, Exology turns raw data into clear insights that support rapid, evidence-based decisions.
We provide digital transformation consulting to embed real-time decision intelligence into your operations.
Exology has helped 150+ companies transform scattered data into clear, actionable decisions that improve operational performance.
Our solutions support companies in Egypt, across the MENA region, and internationally to enhance operational performance.
Read More
Contact us
Whether you have a request, a query, or want to work with us, use the form below to get in touch with our team.