
How Can Managers Spot Hidden Revenue Leaks Using Business Intelligence Dashboards?
Stop losing 5% of your profit to invisible revenue leaks. Learn how BI dashboards and AI agents find pricing errors and unbilled work in real-time to protect your 2026 margins. Discover the power of automated revenue protection. (Updated 15/2/2026)
BUSINESS INTELLIGENCEBUSINESS APPLICATIONS
Key Points
The 5% Profit Drain: Revenue leakage silently consumes up to 5% of annual earnings for most companies, directly impacting EBITDA without any associated costs.
End of Manual Audits: In 2026, manual oversight is insufficient to handle the volume of modern data, making automated BI dashboards the only viable defense.
Breaking Data Silos: Centralizing data from CRMs and ERPs into one dashboard eliminates the blind spots where 42% of revenue leaks occur.
Proactive Protection: Modern dashboards use AI for real-time anomaly detection, catching billing errors and unauthorized discounts before they affect the monthly close.
Predictive Power: Using churn prediction and contract intelligence allows businesses to protect recurring revenue and enforce complex pricing terms automatically.
Foundational Quality: Successful revenue protection requires high quality data governance, as 61% of BI projects fail to show a profit impact due to poor data foundations.
Actionable takeaway: Conduct a "Revenue Integrity Audit" by comparing your last 1,000 sales contracts against actual invoices to identify your current leakage rate.
In the fast paced business environment of 2026, many companies are losing significant amounts of money without even knowing it. This phenomenon is known as revenue leakage. It is the silent erosion of profit that happens when a company fails to collect the full value of the services or products it has provided. While it may seem like a minor administrative issue, the cumulative effect can be devastating to a company's bottom line. Business Intelligence (BI) dashboards have emerged as the most effective tool for managers to find and stop these leaks before they cause permanent damage.
What exactly is revenue leakage and why should managers care in 2026?
Revenue leakage is the unintentional loss of earned income. It occurs at various stages of the revenue cycle, from initial pricing to final payment collection. Unlike a bad debt where a customer simply refuses to pay, leakage happens because of internal failures in systems or processes. In 2026, the complexity of global trade and digital services has made these failures more common and harder to see.
How does leakage differ from standard business losses?
It is important to distinguish between revenue leakage and standard business losses. A business loss often results from external factors like a market downturn or a competitor winning a contract. Revenue leakage is different because the money was already "won" and the work was already done. The cost to provide the service has already been paid by the company, but the payment is never collected. Industry estimates from 2025 show that up to 5% of annual revenue quietly slips through these cracks. Because this lost revenue carries no associated cost, almost every dollar recovered goes directly to the company's net profit.
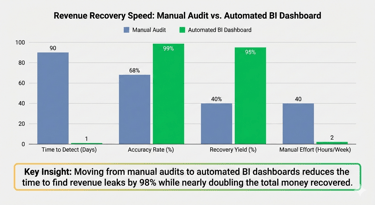
Why are manual processes the primary drivers of financial erosion?
Manual processes are the greatest allies of revenue leakage. When employees rely on spreadsheets or manual data entry to manage complex billing, errors are inevitable. A missed line item on an invoice or a forgotten price increase can go unnoticed for years. According to MGI Research, 42% of businesses experience some form of revenue leakage due to these inefficient processes. In a world where data moves at the speed of light, relying on human eyes to spot tiny discrepancies in thousands of transactions is no longer a viable strategy. A dashboard replaces this manual guesswork with automated, real-time oversight.
How do data silos create the perfect environment for revenue to vanish?
Data silos occur when different departments within a company use separate software systems that do not share information. The sales team might use a CRM, while the finance team uses an ERP, and the operations team uses a project management tool. When these systems are disconnected, the "truth" about what should be billed becomes fragmented.
Why is system fragmentation a billion dollar problem?
Fragmentation creates "blind spots" where revenue can easily disappear. For example, if a sales contract includes a specific discount that is not correctly updated in the billing system, the company will continue to bill the wrong amount indefinitely. Deloitte found that in samples of 20,000 transactions, some firms were leaking 3% to 4% of revenue due to discrepancies between contracts and billing data. This is not just a small error. For a billion dollar company, this represents tens of millions of dollars in lost profit every year.
How can dashboards bridge the gap between CRM and ERP?
A BI dashboard acts as a central hub that pulls data from every siloed system into one view. It allows managers to cross-reference sales agreements in the CRM with actual invoices in the ERP. If the numbers do not match, the dashboard flags the discrepancy immediately. This "single version of the truth" ensures that everyone in the company is looking at the same data. By integrating these systems, managers can see the entire revenue lifecycle in one place, making it much harder for leaks to hide in the gaps between departments.
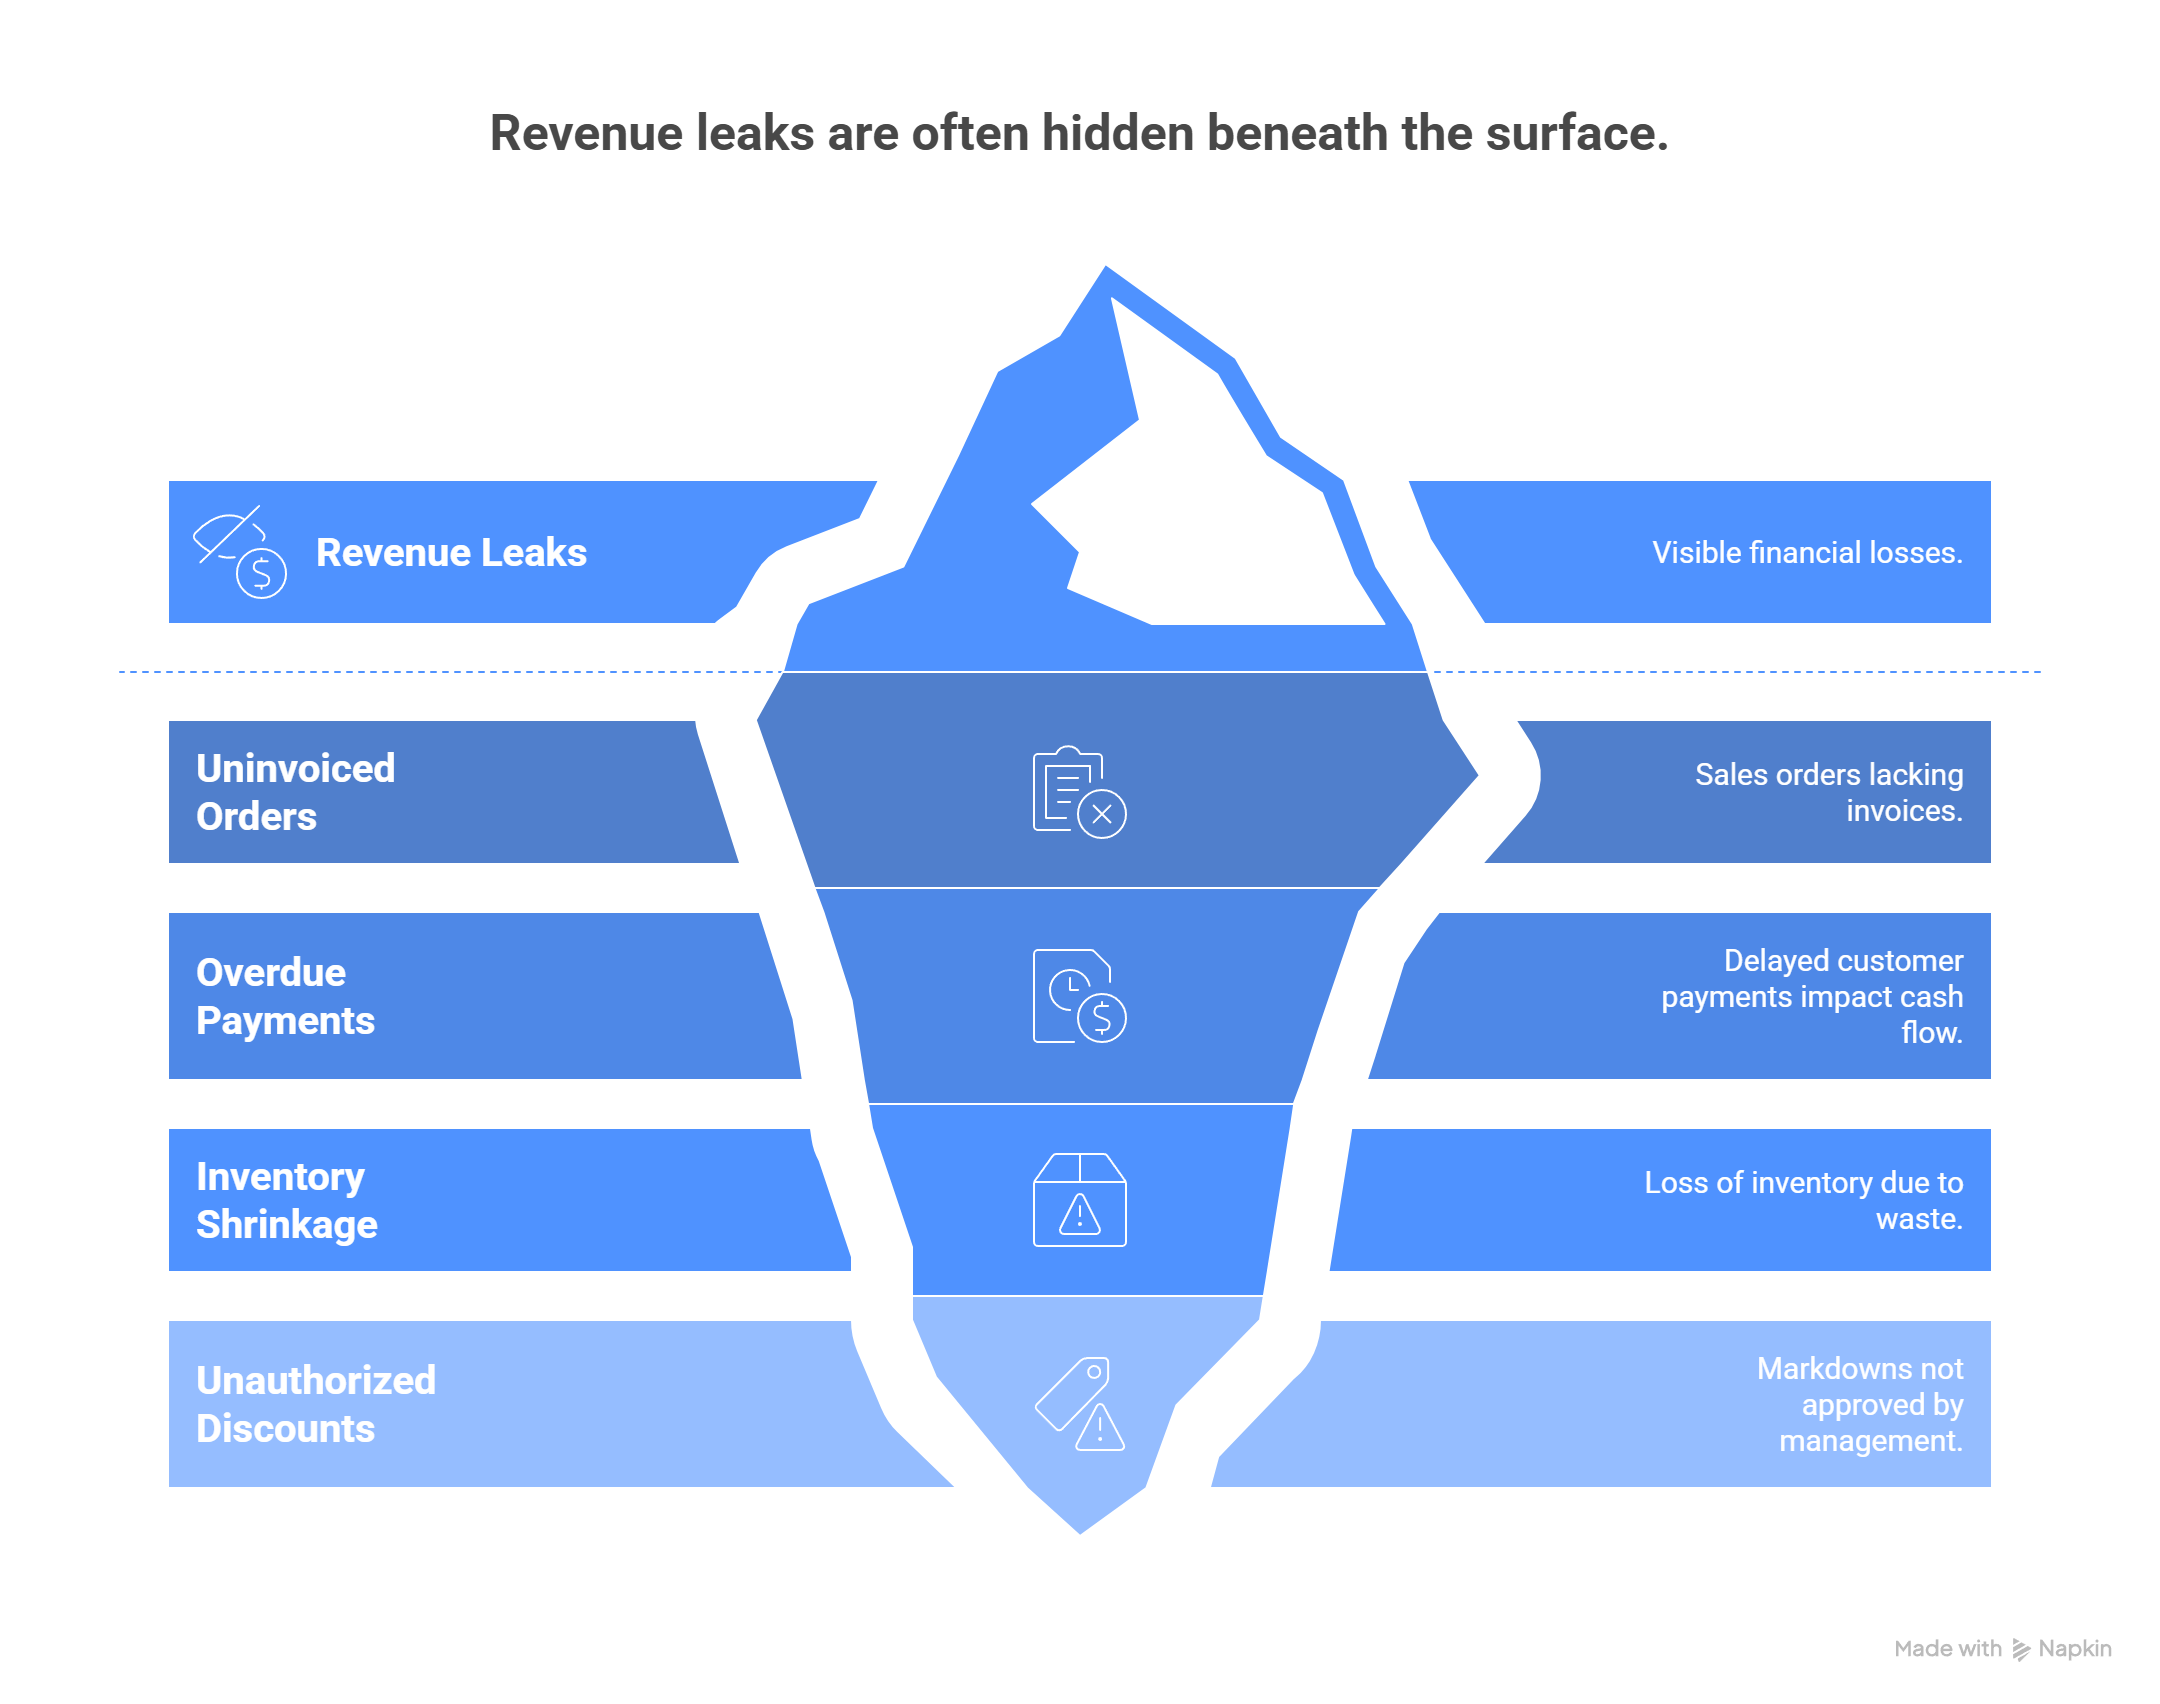
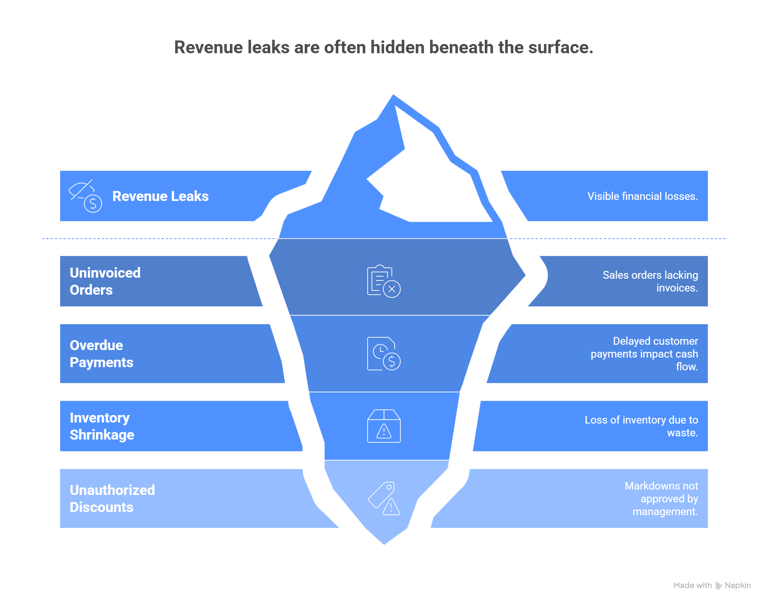
What are the most common "invisible" leaks that BI dashboards can identify?
There are several specific ways that revenue leaks out of a business. Some are related to pricing, while others are linked to how work is tracked and billed.
How do pricing and discount inconsistencies drain margins?
Pricing leaks often happen when outdated price lists are used or when unauthorized discounts are applied. In many cases, a salesperson might promise a special rate to close a deal, but that rate is never approved by management. Without a dashboard to track "Price Realization," these margin killers are hard to find. Companies that use automated pricing analytics see a 2% to 7% increase in return on sales. A dashboard allows you to see exactly what every customer is paying compared to your standard list price, highlighting where you are losing money on every sale.
Why is unbilled work the silent killer of service businesses?
In service industries, "scope creep" is a major source of leakage. This happens when a team provides additional work or support that was not in the original contract, but forgets to bill for it. Without a system to link time tracking to invoicing, this work is essentially given away for free. Scope creep typically accounts for 3% to 5% of project revenue in professional services. A BI dashboard can compare the hours logged by staff against the hours billed to the client, ensuring that every minute of expertise is properly monetized.
How does contract non-compliance affect long term revenue?
Many long term contracts include clauses for annual price increases or penalties for late payments. If these clauses are not tracked and enforced, the company loses out on significant revenue over time. Poor contract management can cost companies around 9% of their annual revenue. A dashboard can monitor these contract milestones and alert the finance team when it is time to trigger a price adjustment. This ensures that the terms of the contract are followed and that the company receives exactly what it was promised.
How does Business Intelligence transform from a viewing tool into a protection system?
In the past, dashboards were used to look back at what happened last month. In 2026, they have evolved into active protection systems that monitor data in real time.
What is automated anomaly detection and how does it catch errors early?
Automated anomaly detection uses AI to monitor every transaction as it happens. The system learns what a "normal" transaction looks like for your business. When it sees something unusual, such as a zero dollar invoice or an extreme discount, it flags it for review before the invoice is even sent. Gartner predicts that AI driven anomaly detection will reduce financial closing errors by 40%. This allows managers to fix errors in minutes rather than discovering them months later during an audit.
How do AI agents move managers from "reporting" to "orchestration"?
AI agents are a step beyond traditional reporting. These agents do not just show you a problem: they can take steps to fix it based on pre-set rules. For example, if an AI agent detects a missed renewal, it can automatically draft an email to the customer or alert the account manager. 23% of organizations are already scaling agentic AI systems across their enterprises as of 2025. This allows managers to spend less time digging through data and more time orchestrating the strategy of the business.
Can predictive analytics stop revenue leaks before they happen?
The most advanced BI dashboards are now predictive. They use historical patterns to tell you where a leak is likely to occur in the future.
How does churn prediction protect your recurring revenue?
Losing a customer is the ultimate form of revenue leakage. BI dashboards can analyze customer behavior to predict who is likely to leave before they actually cancel. By tracking metrics like declining login rates or increasing support tickets, the system provides an early warning. Research shows that reducing churn by just 5% can increase profits by 25% to 95%. Predictive dashboards give your team the chance to intervene and save the relationship before the revenue is lost.
What is "Contract Intelligence" and why is it a 2026 essential?
Contract Intelligence uses AI to "read" thousands of contracts and extract the key financial terms. It then links those terms to your live billing data. This ensures that you never miss a renewal deadline or a price escalation. In the complex world of 2026, contract mismanagement accounts for 60% of all revenue leakage. Having a dashboard that understands the fine print of your agreements is no longer a luxury: it is a requirement for financial health.
How do you measure the ROI of a revenue protection dashboard?
Implementing a BI dashboard is an investment, but the return is often immediate. Because revenue leakage is money you have already earned, every dollar you stop from leaking is pure profit.
What are the key metrics to track on your leakage dashboard?
To be effective, your dashboard should track specific Key Performance Indicators (KPIs) related to revenue integrity. These include:
Invoice Error Rate: The percentage of invoices that require correction.
Price Realization: The difference between your list price and the actual price paid.
Unbilled Revenue Balance: The value of work completed but not yet invoiced.
Days Sales Outstanding (DSO): How long it takes to collect payment after a sale. If your invoice error rate is above 3%, it indicates major process problems that are likely costing you significant money.
Why is data quality the foundation of any successful BI project?
A dashboard is only as good as the data it uses. If your underlying data is messy or incomplete, your dashboard will give you incorrect insights. Only 39% of companies see a profit impact from AI in BI because many skip the foundational step of fixing their data quality. Before building a dashboard, it is essential to establish strong data governance and cleaning processes. When your data is trustworthy, your dashboard becomes a powerful tool that your team can rely on to make critical financial decisions.

How Exology Helps
Exology provides high performance Business Intelligence solutions designed to protect and grow your revenue. We help companies navigate the complexities of modern data to find the hidden inefficiencies that are holding them back. Our team combines technical expertise with deep business insight to deliver results that matter.
Proven Financial Impact: Exology has been able to save our client $130k in one day by identifying and fixing critical revenue leaks in their billing data.
Unmatched Data Expertise: We processed over 10M+ data rows in 2025 alone, ensuring that even the smallest financial discrepancies were identified and resolved.
Efficiency Through Automation: We helped our partners achieve 5,000+ hours of manual work saved in 2025 by replacing tedious spreadsheets with automated dashboards.
Clarity for Decision Makers: With over 1340+ visualizations created, we know how to present data so that managers can take immediate action to protect their margins.
Global Experience: We have delivered over 150 projects worldwide, providing us with a unique perspective on the revenue challenges faced by international enterprises.
Read More
Contact us
Whether you have a request, a query, or want to work with us, use the form below to get in touch with our team.