
The Complete Guide to Capturing, Analyzing, and Visualizing Business Data
Learn how to capture the right business data, choose the right KPIs, analyze results, and turn insights into Business Intelligence.
DATA-DRIVEN CULTURE
Key Points
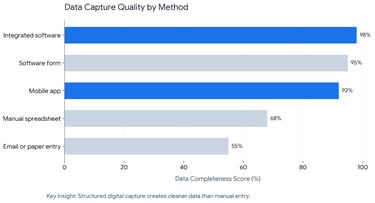
Businesses become data driven by capturing accurate and structured data from daily operations.
Software, mobile apps, and connected systems help companies collect cleaner and more reliable business data.
Different industries need different KPIs to measure performance, efficiency, growth, and customer experience.
Data analysis helps businesses identify trends, solve problems faster, and make smarter decisions.
Dashboards and visualizations make complex business data easier to understand and act on.
Business Intelligence combines data capture, analysis, and visualization into one decision-making system.
Actionable takeaway: Audit how your business currently captures data, define the KPIs that matter most, and build dashboards that help teams make faster decisions.
Why does a data driven company start with the right data?
A data driven company is not built on dashboards alone. It starts with the right data captured at the right moment, in the right format, with the right level of detail. If the data is weak at the start, every report, KPI, and decision after that becomes weaker too.
That is why data quality matters so much. Gartner says poor data quality costs organizations at least $12.9 million a year on average, and IBM reports that 43% of chief operations officers identify data quality issues as their most significant data priority, while over a quarter of organizations estimate annual losses above USD 5 million.
This is not only a data team problem. It is a business problem. When companies capture the wrong data, they lose time correcting errors, they trust the wrong numbers, and they make decisions that look logical but are built on weak foundations. That is why the first step in becoming data driven is not buying a tool. It is designing a better way to capture information.
How should a business capture the right data?
The best data capture method is the one that fits the real workflow. If people already work in software, capture the data there. If teams are in the field, capture it through a mobile app. If the process is repetitive, connect systems so the data moves automatically instead of being typed again and again.
A strong setup usually mixes several capture methods:
Software forms and internal systems for sales, finance, operations, HR, and approvals.
Mobile apps for field teams, delivery teams, inspectors, technicians, and on-site staff.
Web apps and portals for customers, partners, suppliers, or internal departments.
Integrated platforms such as CRM, ERP, POS, ticketing systems, or inventory systems.
Automated capture through APIs and workflows so data flows between tools without manual re-entry.
The point is simple. Capture data where work happens. Do not force teams to leave the workflow, open another file, and retype information later. The farther the data capture step is from the real action, the more errors you will get.
A good capture process also needs rules. Every field should have a purpose. Every metric should have a definition. Every team should know who owns the data, who reviews it, and how often it gets checked. That is how businesses move from random information collection to reliable decision-making.
When does a mobile app make data capture better?
A mobile app is often the best choice when the data is created in motion. Field sales, site visits, delivery updates, inspections, stock checks, maintenance work, and customer service visits are all strong examples.
Mobile apps work well because they are simple to use in real time. They can guide the user with dropdowns, required fields, photo uploads, GPS stamps, barcode scans, and validation rules. That means the business gets cleaner data at the source instead of fixing mistakes later.
This matters because the quality of analysis depends on the quality of capture. If teams use spreadsheets, WhatsApp messages, paper forms, or scattered emails, the business ends up with delays, duplicate entries, and missing information. If they use a simple mobile app tied to the business process, the data arrives faster and in a more usable form.
What else can capture business data automatically?
Not every data point should depend on a person typing it in. Many of the best systems capture data automatically through integrations. A CRM can track lead stages. An ERP can capture inventory and purchasing. A billing system can track invoices and payment status. A support system can track ticket volume and resolution times.
This is where software becomes powerful. It does not just store data. It connects departments.
Microsoft Power BI says it is a unified, scalable platform for self-service and enterprise BI that can connect to and visualize any data, and Microsoft also says BI tools speed up information analysis and performance evaluation, helping companies reduce inefficiencies, flag problems, and find areas of future growth.
That is the right idea for capture too. If the business already uses digital systems, the goal is to connect them so the data is captured once and reused many times.
Which KPIs should a business track?
The right KPIs depend on the type of business. A company should not copy another company’s dashboard and expect it to work. A better approach is to choose KPIs that match the real business model.
What KPIs should retail businesses track?
Retail businesses usually need to track:
Sales by product
Average order value
Conversion rate
Return rate
Inventory turnover
Gross margin
Customer repeat purchase rate
These KPIs show what is selling, what is stuck, and what customers keep buying.
What KPIs should service businesses track?
Service businesses usually need:
Lead response time
Proposal win rate
Utilization rate
Project delivery time
Billable hours
Client retention
Customer satisfaction
These KPIs show how efficiently the team turns opportunities into revenue.
What KPIs should manufacturing businesses track?
Manufacturing businesses often need:
Production output
Defect rate
Downtime
On-time delivery
Scrap rate
Machine utilization
Cost per unit
These KPIs help leaders see where production slows down and where quality drops.
What KPIs should logistics businesses track?
Logistics businesses usually benefit from:
On-time delivery rate
Average delivery time
Failed delivery rate
Shipment accuracy
Vehicle utilization
Fuel cost per trip
Order tracking completion
These KPIs show whether the operation is fast, accurate, and cost-effective.
What KPIs should healthcare businesses track?
Healthcare businesses often need:
Patient wait time
Appointment no-show rate
Bed occupancy
Treatment turnaround time
Readmission rate
Claim rejection rate
Staff workload
These KPIs help teams improve service, capacity, and patient experience.
What KPIs should SaaS and subscription businesses track?
SaaS businesses usually track:
Monthly recurring revenue
Churn rate
Customer acquisition cost
Lifetime value
Trial-to-paid conversion rate
Activation rate
Expansion revenue
These KPIs show how well the business grows and retains customers.
The important thing is not the list itself. It is the discipline behind it. A business should only track KPIs that lead to action. If a metric does not change a decision, improve a process, or reveal a risk, it is probably not worth putting on the main dashboard.
Why should you analyze captured data?
Capturing data is only the first step. Analysis is where the business starts to understand what the data means. Without analysis, the company only has numbers. With analysis, the company gets patterns, causes, risks, and opportunities.
Harvard Business School Online says data-driven decision-making means using data to inform a decision and validate a course of action before committing to it. The same article also notes that highly data-driven organizations are three times more likely to report significant improvements in decision-making than companies that rely less on data.
That is the real value of analysis. It helps teams move from guessing to knowing.
Here is what analysis can reveal:
Which products or services are growing
Which customers are most profitable
Which departments are slowing down
Which processes create cost
Which trends are changing over time
Which problems need immediate action
Good analysis also helps leaders ask better questions. Instead of asking, “What happened?” they start asking, “Why did it happen?” and “What should we do next?” That is when data begins to shape strategy.

Why is data visualization so important?
Analysis becomes much more useful when it is visual. People do not read raw tables the same way they read a chart. A dashboard helps a team see patterns faster, compare performance, and spot problems before they grow.
IBM defines data visualization as the use of charts, plots, infographics, and animations to communicate complex relationships in a way that is easy to understand. Tableau also explains that modern BI combines analysis, data mining, visualization, and best practices so organizations can make more data-driven decisions.
That is why visualization matters so much:
It turns complexity into clarity
It helps non-technical teams understand the business
It makes trends easier to spot
It shows exceptions and anomalies faster
It supports faster meetings and faster action
Harvard Business School Online says visualization is a huge part of analysis and that it is nearly impossible to derive meaning from a table of numbers. IBM also notes that visual displays communicate complex data relationships in a way that is easy to understand.
A good dashboard should not try to show everything. It should show the right things. Leaders need a clear view of:
Performance against targets
Changes over time
Differences between teams, products, or regions
Alerts when something goes wrong
The few KPIs that matter most
The best dashboards do not create more noise. They reduce noise.
What is all of this called?
When a business captures the right data, analyzes it properly, and visualizes it clearly, it becomes Business Intelligence.
IBM defines BI as a set of technological processes for collecting, managing, and analyzing organizational data to yield insights that inform business strategies and operations. Tableau says BI combines analytics, data mining, visualization, data tools, and best practices to help organizations make better data-driven decisions.
That means BI is not just a dashboard.
It is not just a report.
It is not just software.
It is the full system that helps a business move from raw data to useful action.
Why does Exology call this Decision Engines?
Exology calls this Decision Engines because the goal is not to collect data for its own sake. The goal is to build a system that helps leaders see what is happening and decide what to do faster.
Exology’s own site says the company helps organizations turn scattered data into real-time insights, and its Decision Engines page says it builds data systems that bring data together, structure it properly, and give leaders a reliable view of what is happening in the business. Exology also says it has completed over 200 projects for 150+ businesses across 20+ countries in 10+ key industries.
That is a strong fit for companies that want more than reporting. They want:
clean data capture
connected systems
tracked KPIs
analysis that explains the story
dashboards that show what matters
faster decisions based on trusted information
When all of these pieces work together, the business stops reacting late and starts acting early.
How Exology Helps
We help businesses design data capture systems that fit the real workflow, whether that means software forms, mobile apps, web apps, or connected business tools.
We build dashboards that track the KPIs that matter for each business model, so leaders see performance clearly instead of drowning in unused numbers.
We connect scattered systems into one trusted view, so teams stop arguing over different versions of the truth and start making decisions from the same data.
We turn analysis into action by building Decision Engines that show what is happening, why it is happening, and what leaders should do next.
We help companies move from manual reporting to faster, cleaner, and more reliable decision-making, backed by Exology’s experience across 200+ projects, 150+ businesses, 20+ countries, and 10+ key industries.
Read More
Contact us
Whether you have a request, a query, or want to work with us, use the form below to get in touch with our team.