Dashboards for Logistics: Turning Complex Supply Chains into Clear Insights
Master logistics in 2026 using real-time dashboards and Agentic AI to bridge the visibility gap. Learn to cut inventory costs by 40% and automate global supply chain tracking with data-driven insights. (updated 9/2/2026)
BUSINESS INTELLIGENCEBUSINESS APPLICATIONS
Key Points
Global Visibility Gap: Only 6% of businesses currently have full supply chain visibility, leaving most companies vulnerable to unexpected disruptions.
Agentic AI Integration: Modern dashboards are shifting from simple reporting to "Agentic AI" that can autonomously execute restocking or rerouting decisions.
Financial Efficiency: AI-driven forecasting and dashboard optimization can reduce inventory costs by up to 40% and lower freight spend by 15%.
The Power of One Source: Centralized dashboards eliminate data silos, providing a "single version of truth" that accelerates executive decision-making.
Last-Mile Growth: With the last-mile market projected to hit $487 billion by 2035, tracking real-time delivery KPIs is essential for customer retention.
Sustainability Compliance: Dashboards are now required tools for tracking Scope 3 emissions and meeting global ESG reporting standards by 2026.
Actionable takeaway: Audit your current supply chain data for silos and implement a centralized, real-time dashboard to automate routine carrier and inventory monitoring.
The global logistics landscape has moved past the era of simple tracking. In 2026, volatility is no longer an exception; it is a permanent feature of international trade. To stay competitive, businesses are moving away from reactive firefighting and toward proactive orchestration. A well-designed logistics dashboard is the heart of this transition. It turns millions of rows of fragmented data into clear, actionable steps that save money and improve service.
How does real-time visibility impact global supply chain resilience?
Real-time visibility is the ability to see exactly where goods are and how they are moving at any given second. Without it, managers are forced to make decisions based on yesterday’s news. In a world where a single port delay can disrupt an entire production line, visibility is the difference between profit and loss.
What is the current state of supply chain visibility?
Despite the clear benefits, true visibility remains rare. According to a 2025 report by Procurement Tactics, only 6% of businesses have achieved full supply chain visibility. This means the vast majority of companies are operating with blind spots. These gaps lead to unexpected stockouts and missed delivery windows. When a company cannot see a delay coming, they lose the chance to reroute or find an alternative supplier.
Why do fragmented data silos hinder growth?
Data silos happen when different departments use different software that does not talk to each other. The warehouse might use one system while the transportation team uses another. This fragmentation makes it impossible to get a full picture of the supply chain. In 2025, 82% of supply chain organizations increased their IT spending to solve this very problem. A dashboard breaks these silos by pulling data from every source into one central view.
How do dashboards create a "single version of truth"?
A logistics dashboard acts as a "single version of truth" for the entire company. Whether you are the CEO or a warehouse manager, everyone looks at the same live numbers. This alignment speeds up decision making. Instead of having a meeting to discuss what the data says, teams can meet to discuss what the data tells them to do. This shift in focus allows companies to respond to disruptions in minutes rather than days.
Why is Agentic AI the next frontier for logistics dashboards?
Artificial Intelligence has evolved significantly over the last year. We are moving beyond "Generative AI" that just writes text and into "Agentic AI" that takes action. This technology is now a core component of modern Business Intelligence solutions.
What is the difference between traditional AI and Agentic AI?
Traditional AI is reactive. It looks at a dashboard and highlights a problem for a human to fix. Agentic AI is proactive. Gartner identified Agentic AI as a top supply chain technology trend for 2025 and 2026. These AI agents do not just report a stock shortage; they can autonomously suggest a restock order or find a faster shipping route based on pre-set rules. They act as "digital co-planners" that work alongside human teams.
How do AI agents automate routine decision-making?
AI agents handle the repetitive, data-heavy tasks that usually take up a manager's time. For example, an agent can monitor carrier performance in real time. If a carrier's on-time delivery rate drops below a certain level, the agent can automatically flag them for review. This allows human experts to focus on complex strategy while the AI handles the routine monitoring. SAP notes that AI agents are becoming "digital colleagues" that help synchronize processes from demand sensing to the last mile.
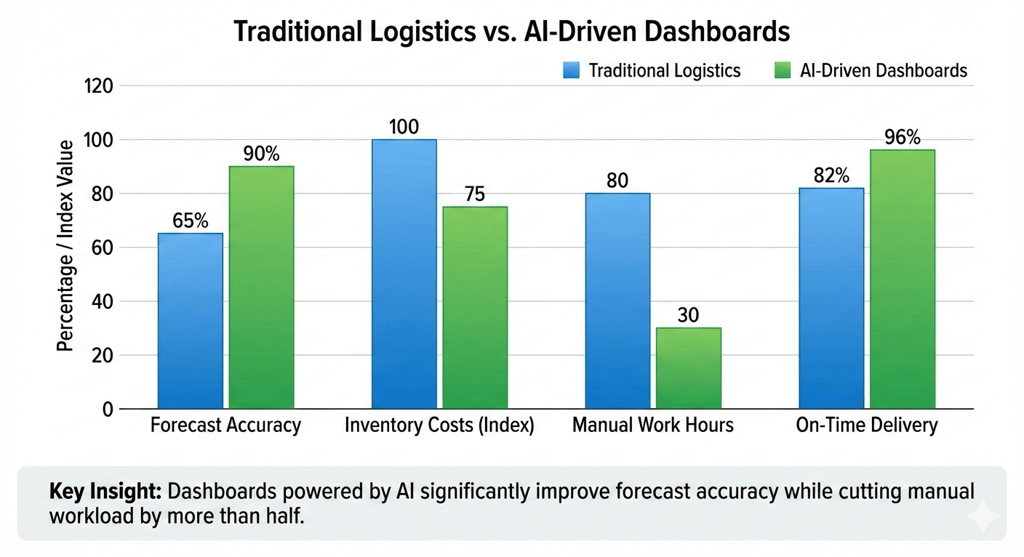
Can AI-driven forecasting really reduce inventory costs?
Yes, the impact is measurable. Research from McKinsey shows that AI-based forecasting can reduce errors by 20% to 50%. By predicting exactly what customers will buy and when, companies can keep less stock on hand. This "just-right" inventory model can reduce warehousing costs by up to 40%. It also prevents "lost sales" from stockouts, which has traditionally been a trillion-dollar problem for the industry.
How do dashboards optimize the "last mile" experience?
The last mile is the final leg of the journey, where the product reaches the customer's door. It is the most expensive part of the supply chain and the most important for customer satisfaction.
Why has last-mile delivery become a board-level growth lever?
In the past, delivery was just a back-office cost. Today, it is a way to win and keep customers. The global last-mile delivery market is expected to grow from $197 billion in 2025 to over $487 billion by 2035. Companies that provide fast, transparent delivery grow faster than those that do not. A last-mile dashboard allows executives to see how delivery speed directly impacts their sales growth.
What KPIs should you track in a last-mile dashboard?
To improve the last mile, you must track the right Key Performance Indicators (KPIs). A high-performing dashboard should include:
On-time Delivery (OTD): The percentage of orders delivered by the promised time.
Cost Per Delivery: The total cost including fuel, labor, and maintenance.
Driver Idle Time: How much time vehicles spend sitting in traffic or at hubs.
Customer Sentiment: Real-time feedback provided immediately after delivery. E-commerce return rates hit 20.4% in late 2024, and many of these returns are caused by poor delivery experiences. Tracking these KPIs helps you find and fix the root causes of these issues.
How does route optimization lower carbon emissions?
Efficiency is not just about speed; it is about the environment. Advanced dashboards use route optimization to find the shortest, fastest paths for every vehicle. This reduces fuel consumption and lowers the carbon footprint of every package. In 2026, 88% of supply chain executives say ESG goals are a top priority. A dashboard makes it easy to report on these improvements to investors and customers.
Can a logistics dashboard help manage transportation and freight costs?
Freight costs are one of the biggest expenses for any logistics company. Prices change constantly based on fuel, capacity, and global trade rules.
How do you identify hidden inefficiencies in carrier performance?
Many companies lose money because they stick with the same carriers out of habit. A dashboard allows you to compare every carrier based on data, not relationships. You can see which carriers consistently have the highest "tender acceptance rates" and who causes the most delays. By weeding out poor performers, you ensure your money is spent on the most reliable partners.
What role does predictive analytics play in reducing freight spend?
Predictive analytics looks at historical trends and current market data to predict future freight rates. This allows companies to lock in lower prices before a surge happens. Organizations that use these data-driven forecasting tools can cut their operating costs by 15% to 25% within the first year. Specifically, freight costs can be reduced by 8% to 15% through better planning and lane optimization.
How to manage global trade risks and tariffs with data?
Geopolitical shifts often lead to sudden changes in tariffs and trade rules. McKinsey found that 82% of supply chains are affected by new tariffs. A logistics dashboard that includes "global risk monitoring" can alert you to these changes immediately. This gives your team time to find alternative sourcing or adjust pricing before the financial impact hits the bottom line.
How do dashboards support sustainability and ESG goals in 2026?
Sustainability is no longer just a marketing buzzword. It is a reporting requirement. For many companies, the supply chain is where the majority of their environmental impact happens.
What is Scope 3 emissions tracking?
Scope 3 emissions are the indirect emissions that happen in a company's value chain, such as transportation by third-party carriers. In 2026, regulatory pressure is forcing companies to track these emissions with high accuracy. A sustainability dashboard pulls data from carriers and fuel logs to provide a clear report on the total carbon impact of the logistics network.
How does data help move from sustainability "targets" to "action"?
Many companies have "Net Zero" targets for 2030 or 2040. However, without data, these targets are just promises. 2026 marks a global shift from "ambition" to "execution". Dashboards provide the evidence needed to show that a company is actually making progress. For example, a dashboard can show that switching to electric vehicles or optimized routes has reduced emissions by a specific percentage. This data is essential for maintaining brand trust and meeting investor expectations.

How Exology Helps
Exology turns complex logistics data into clear and actionable dashboards. We help companies modernize their operations through advanced Business Intelligence and AI solutions. Our team works with organizations to ensure they have the tools and training needed to lead in a data-driven world.
Proven Operational Impact: We helped our clients achieve over 5,000+ hours of manual work saved in 2025 through intelligent automation.
Massive Data Scale: Our solutions are built for high-performance, with over 10M+ data rows processed in 2025 alone to ensure real-time accuracy.
Rapid Financial Results: Exology has been able to save our client $130k in one day by identifying and fixing critical supply chain inefficiencies.
Extensive Global Experience: We have delivered over 150 projects worldwide and worked in 20+ countries, providing us with a global perspective on logistics challenges.
Future-Ready Technology: We are at the forefront of AI adoption, with 2 custom AI agents already deployed and actively empowering businesses in 2025.
Read More
Contact us
Whether you have a request, a query, or want to work with us, use the form below to get in touch with our team.