
How Data Analytics and Visualization help executives lead with confidence
Learn how data analytics and visualization empower executives in Egypt and the MENA region to make faster, smarter and more confident decisions in a complex market.
DATA ANALYTICS
Key Points
Executives need real-time data analytics to make confident decisions in fast-moving MENA markets
Visualization turns scattered data into clear trends for executive business intelligence
Consolidated dashboards reduce data fatigue with a single view of sales, finance, and operations
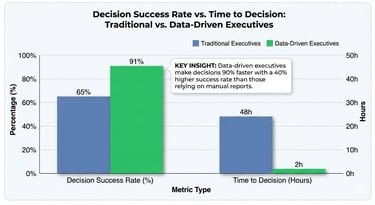
Data-driven leadership shifts company culture from opinions to facts and transparency
Visual dashboards help busy leaders assess business health in seconds using the Three-Second Rule
AI-powered and predictive insights improve agility, risk management, and future planning
Actionable takeaway: Implement a real-time executive dashboard that consolidates key metrics into one clear view and review it daily before making strategic decisions
Modern leadership requires more than just gut feeling. In fast-moving markets like Egypt, Saudi Arabia, and the UAE, executives face a flood of information every day. This information often comes from different departments and in different formats. Without a way to organize it, leaders can feel overwhelmed.
Data analytics and visualization transform this messy information into clear, actionable stories. This post answers the most important questions about how high-level leaders use data to stay ahead of the competition.
Why is data analytics and visualization critical for executive business intelligence?
Executives are responsible for the big picture. You do not need to see every single transaction. You need to see the trends that affect the whole company. Executive business intelligence is the process of using data to guide these high-level choices.
What happens when executives make decisions without real-time data?
If you rely on monthly reports, you are looking at the past. By the time a problem appears on a PDF, it has already cost the company money. In volatile economies, a week-old report is often useless. McKinsey research shows that by mid-2025, 88% of organizations were already using AI and data tools in at least one business function to stay current. Real-time data helps you see a problem the moment it starts.
How does visualization solve the problem of "Data Fatigue"?
Most leaders have too many dashboards. When every department has its own charts, the executive gets "data fatigue." True data analytics and visualization consolidate these charts. They create a "Single Pane of Glass." This means you can see sales, operations, and finance in one view. This clarity helps you see how a delay in shipping affects your total profit.
How does data-driven executive leadership change company culture?
A leader's behavior sets the tone for the entire organization. When an executive asks for data to back up a request, the whole company starts to value facts over opinions. This shift is the core of data-driven executive leadership.
Can visualization tools help executives communicate strategy better?
Strategy is often abstract. It can be hard for employees to see how their work affects the company's goals. Visual charts make these goals physical. Recent studies by Straits Research indicate that companies using data analytics to guide their decisions are 5% more productive and 6% more profitable. When you show your team a chart showing growth, they understand the mission better.
How do data insights reduce internal politics?
In many boardrooms, the person with the loudest voice often wins. Data changes this dynamic. When the numbers are visualized for everyone to see, the debate shifts. You stop arguing about what happened. You start discussing how to improve the future. This creates a culture of transparency and shared goals.
What are the specific benefits of visual dashboards for busy leaders?
A busy executive might only have five minutes between meetings. You cannot spend that time digging through a spreadsheet. You need an interface designed for speed.
How does the "Three-Second Rule" work for executive reporting?
A great executive dashboard follows the "Three-Second Rule." You should be able to look at the screen and know the health of the business in three seconds. We use clear colors like green for "on track" and red for "at risk." Gartner predicts that by 2027, 50% of business decisions will be augmented or automated by AI agents to speed up this process. This allows you to focus only on the areas that need your attention.
How does visualization help with global expansion?
For companies in Egypt or the MENA region looking to go international, data is the bridge. A visual map of your global sales can highlight new opportunities in seconds. You might notice a sudden spike in demand from a country you had not considered. This visual insight allows you to move faster than competitors who are still reading text reports.
Why is digital transformation the key to executive agility in the MENA region?
The MENA region is undergoing a massive digital shift. Governments and private sectors are investing heavily in new technology. Executives who do not adapt risk being left behind.
How do AI-powered insights support faster decision-making?
AI does not just show you what happened. It predicts what will happen next. Gartner reports that organizations emphasizing AI literacy for executives will achieve 20% higher financial performance by 2027. Predictive analytics can warn you about a potential cash flow shortage three months in advance. This gives you time to adjust your strategy before the shortage becomes a crisis.

How Exology Helps
Exology understands the pressure that executives in Egypt and the MENA region face. We do not just build charts: we provide the clarity needed to lead with certainty. By partnering with Exology, leaders experience the direct impact of high-level data analytics and visualization through proven results:
Immediate ROI and Risk Mitigation: Our insights have allowed clients to save up to $130k in a single day by identifying critical inefficiencies.
Reclaiming Your Time: We have helped organizations save over 5,000 hours of manual work in 2025 alone, allowing executives to focus on strategy instead of spreadsheets.
Proven Executive Dashboards: With over 40 live dashboards currently empowering leaders, we provide a "Single Source of Truth" that simplifies complex decision-making.
Global Expertise and Trust: Having delivered over 150 projects worldwide, we bring international best practices to local markets.
Scalable Intelligence: We have processed over 10 million rows of data to provide the deep analysis that 50+ companies rely on to grow their operations.
Read More
Contact us
Whether you have a request, a query, or want to work with us, use the form below to get in touch with our team.