The Emotional Need for Dashboards: Why Managers Feel Calmer, More Confident, and More in Control
Learn how dashboards reduce stress, build confidence, and help managers make better financial and operational decisions with clearer BI systems in real time.
BUSINESS INTELLIGENCE
Key Points
Good dashboards reduce uncertainty and help managers feel calmer and more in control.
Business intelligence systems improve confidence by making financial and operational data easier to understand.
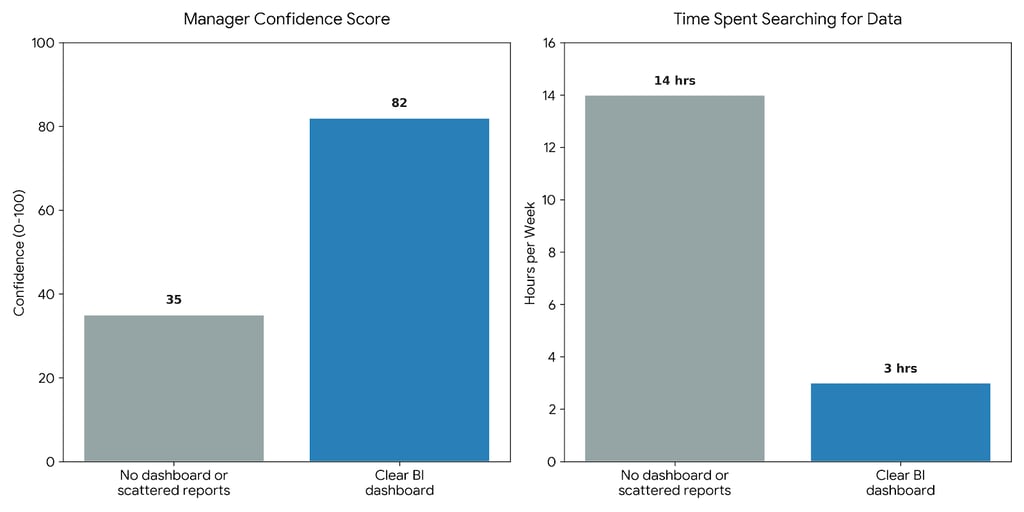
Scattered reports and disconnected data create stress, delays, and decision fatigue.
Clear dashboards help managers answer questions faster and make stronger decisions in meetings.
Real-time visibility improves trust in the numbers and helps teams react earlier to problems and opportunities.
The best dashboards focus on clarity, relevance, and a single source of truth instead of showing too much information.
Actionable takeaway: Audit your current reporting process and identify where managers still rely on spreadsheets, manual updates, or disconnected data sources.
What is the emotional need for dashboards?
Most companies talk about dashboards as if they are just reporting tools. That is only part of the story.
The real emotional need for dashboards is simpler. Managers want to feel clear, calm, and in control when they make decisions. They do not want to guess. They do not want to walk into meetings unsure of what the numbers mean. They want to know what is happening, why it is happening, and what to do next.
That is why the emotional need for dashboards matters. A good dashboard does not only show data. It reduces uncertainty. It helps leaders trust what they see, think more clearly, and make better calls under pressure.
Exology has seen this firsthand across 200+ projects, for 150+ businesses, in 20+ countries, across 10+ key industries. That matters because this idea is not theory. It comes from real teams, real reporting pain, and real management decisions.
Why do dashboards make managers calmer?
A manager rarely feels stressed because of one number on a screen. Stress usually comes from scattered information, slow answers, and low trust in the data.
That problem is very common. In a 2023 article, Harvard Business Review reported that Gartner surveyed nearly 1,000 employees and managers and found that 38% of employees say they receive an excessive volume of communications at their organization. When information is everywhere, people spend more energy searching than deciding.
A good dashboard reduces that noise. It puts the important metrics in one place. It helps managers stop hunting through spreadsheets, emails, chat threads, and slide decks. That simple change can lower pressure in meetings and make planning feel more controlled.
Less information noise
When data is scattered, every question becomes a chase. People ask finance for one number, operations for another, and sales for a third. By the time the answer arrives, the meeting has already lost momentum.
A strong dashboard brings the key numbers together. That means less confusion, fewer follow-up requests, and less mental load for the people who have to make decisions. This is one reason dashboards feel emotionally valuable, not just operationally useful.
More trust in the numbers
Trust changes everything. If managers do not trust the numbers, they do not trust the decision.
Gartner defines analytics and business intelligence platforms as tools that model, analyze, and visualize data to support informed decision making and value creation, and says they create interactive dashboards, reports, and visualizations that uncover patterns and optimize operations. That definition matters because it shows what BI is really for. It is not only for display. It is for decision support.
When a dashboard is built well, managers are less likely to debate where the number came from and more likely to discuss what the number means. That shift creates calmer meetings and stronger leadership.
Faster answers in meetings
A meeting feels very different when someone can answer a question immediately.
Instead of saying, “Let me check and get back to you,” a manager can open the dashboard and see the trend, the source, and the comparison. That speed reduces pressure. It also makes the manager feel prepared, which improves confidence in the room.
How do dashboards improve decision confidence?
Decision confidence is not the same as being loud or fast. It is the ability to make a choice with enough clarity to act without constant second-guessing.
McKinsey has said that by 2025, the data-driven enterprise would be one where data is embedded in every decision, interaction, and process, and that organizations are capable of better decision making as well as automating basic day-to-day activities and regularly occurring decisions. It also notes that many business problems still take months or years to solve when organizations rely on traditional approaches instead of data-led workflows.
That is the key point. Dashboards help leaders move from uncertainty to action. They shorten the distance between question and answer.
Financial confidence
Financial decisions become easier when managers can see revenue, margin, cost, collections, and forecast movement in one place.
Without that view, leaders often make decisions based on fragments. They may approve spending, delay hiring, or cut budgets without seeing the full picture. A good BI system does not remove judgment. It improves judgment by giving managers a clearer picture of financial reality.
That is where the emotional need comes in. Financial visibility lowers fear. It makes leaders feel that they are making decisions from facts, not instinct alone.
Managerial confidence
A dashboard also helps managers lead people better.
When a manager can see team performance, delivery status, bottlenecks, and trend movement, it becomes easier to set priorities and give direction. They can explain decisions with more confidence because the evidence is visible.
This matters especially in cross-functional teams. If sales, finance, operations, and leadership are all reading from different numbers, alignment becomes hard. A shared dashboard creates a shared starting point.
Confidence in fast-changing situations
McKinsey also notes that in a data-driven enterprise, employees are empowered to ask how innovative data techniques could resolve challenges in hours, days, or weeks, not only through long roadmaps. That idea matters because confidence often grows when people know they can respond quickly.
When a dashboard shows what changed today, not only what happened last month, managers feel less trapped by the past. They can react earlier, which makes them feel more in control.
What happens when dashboards are missing?
When dashboards are missing, the problem is not only slower reporting. The deeper problem is emotional strain.
Managers begin to second-guess themselves. They rely more on memory than evidence. They ask more questions because they cannot see the full picture. Over time, that creates fatigue.
Second-guessing increases
Without a clear dashboard, managers often keep checking the same numbers in different places. They may not know which version is right. That uncertainty is exhausting.
Decision makers already struggle when groups become slow or overly complicated. McKinsey notes that decision makers fed up with slow or subpar results need better practices to improve decision making and move beyond “death by committee.” Dashboards help by giving people one factual base to work from.
Delays become normal
When data is hard to find, leaders delay action. They wait for one more report. One more call. One more file.
That delay has a cost. In financial terms, it can mean missed opportunities or slower response to risk. In managerial terms, it creates frustration and weakens trust across the team.
Emotional exhaustion builds up
Managers do not only get tired from making decisions. They get tired from searching for the truth.
A dashboard removes some of that burden. It does not make hard decisions easy, but it makes them more manageable. That is a major emotional benefit, and it is often ignored in BI conversations.
What makes a dashboard emotionally useful?
A dashboard is emotionally useful when it helps the user feel oriented. It should answer questions quickly, reduce confusion, and support action.
It answers the right questions
A good dashboard should not try to show everything. It should show the things that matter most for the role.
A manager usually needs a simple structure:
What changed?
Why did it change?
What should we do now?
If a dashboard answers those questions well, it feels useful. If it only shows charts without context, it creates more noise.
It stays current
Dashboards feel more reassuring when they are current enough to trust.
Microsoft describes Power BI as a unified platform where you can connect to and visualize any data and bring visuals into the apps people use every day. That matters because the dashboard should fit into the manager’s workflow, not sit outside it.
When updates are regular and visible, managers do not need to wonder whether they are looking at stale data. That lowers stress and improves confidence.
It is easy to read at a glance
If a dashboard is hard to read, people avoid it.
Good dashboards use simple labels, clear hierarchy, and a clean layout. They make important trends obvious. They show the difference between signal and noise. That visual simplicity is not just a design choice. It is a mental relief.
What should leaders look for in a dashboard system?
Leaders should not ask only whether a dashboard looks good. They should ask whether it helps them think better.
One source of truth
If different teams use different numbers, the organization spends too much time debating the data itself.
A strong dashboard system should pull from trusted sources and create a single view. Gartner’s definition of ABI platforms notes that they integrate data from multiple sources, including databases, spreadsheets, cloud services, and external feeds, to provide a unified view of data and break down silos. That unified view is what lowers confusion.
Clear KPI structure
A good dashboard should not overwhelm the user with too many metrics. It should organize KPIs around business goals.
For a finance leader, that might mean margin, cash flow, and collection performance. For an operations leader, it might mean throughput, delays, and backlog. For a sales manager, it might mean pipeline, conversion, and revenue pacing.
The more clearly the dashboard reflects the role, the more confident the manager feels using it.
Real-time or near real-time visibility
McKinsey says the data-driven enterprise is one where data is processed and delivered in real time, and that faster data delivery supports more powerful insights. McKinsey, “The data-driven enterprise of 2025”. That does not mean every KPI needs live updates every second. It means leaders should get the right level of freshness for the decision they are making.
When the timing is right, the dashboard feels dependable. And when it feels dependable, managers use it more often.
What does this mean for BI strategy?
This is the most important shift.
Dashboards should not be built as decoration. They should be built as decision systems.
That means BI strategy should focus on helping leaders:
understand what is happening
trust the numbers
reduce uncertainty
move faster
make stronger financial and managerial decisions
This is also where modern BI is heading. Gartner’s 2025 data and analytics predictions say that by 2027, 50% of business decisions will be augmented or automated by AI agents for decision intelligence. That shows the future of dashboards is not passive reporting. It is smarter decision support.
The goal is not to make managers dependent on screens. The goal is to make them more certain, more focused, and more effective.
A good dashboard changes how managers feel
This is the part many companies miss.
A good dashboard does not just change what managers see. It changes how they feel while managing the business.
It makes them feel:
calmer, because the noise is lower
more confident, because the facts are clearer
more in control, because the right numbers are visible
less reactive, because they can spot change earlier
more prepared, because they can answer questions faster
That emotional shift matters. Better decisions do not come only from more data. They come from clearer data presented in a way that people can trust and act on.
How Exology Helps
We connect data from multiple systems into one clear view so managers can stop chasing numbers and start making decisions faster.
We build dashboards that show the right KPIs for each role, which helps leaders feel calmer, more prepared, and more confident in meetings.
We turn scattered reports into a single source of truth, so finance and management teams work from the same numbers.
We automate repetitive reporting work, which reduces noise, saves time, and gives teams more space to think.
We train teams to use dashboards with confidence, so the system becomes part of daily decision-making, not just another tool.
We design BI systems around real business questions, so leaders can see what changed, why it changed, and what to do next.
Read More
Contact us
Whether you have a request, a query, or want to work with us, use the form below to get in touch with our team.