
From Excel to Enterprise BI: A Roadmap for Growing Businesses
Learn how growing businesses in Egypt can transition from Excel to scalable enterprise BI solutions to gain smarter insights, faster decisions, and scalable growth.
BUSINESS INTELLIGENCE
Key Points
Growing businesses relying on Excel face challenges like scattered data, slow updates, and error-prone reporting, limiting decision-making speed.
Scattered information across departments delays insights; enterprise BI consolidates data for faster, accurate decisions.
Enterprise BI solutions offer centralized integration, interactive dashboards, self-service analytics, automated alerts, and scalable architecture.
BIaaS provides subscription-based access, continuous updates, and support, reducing upfront costs and infrastructure burden compared with project-based dashboards.
Transitioning to enterprise BI involves assessing data, selecting suitable tools, integrating systems, and training teams for adoption and data-driven decision-making.
Common hurdles include data quality issues, resistance to change, and maintaining real-time reporting; phased implementation and user engagement help overcome these.
Actionable takeaway: Replace siloed spreadsheets with enterprise BI or BIaaS solutions, integrate key systems, and train teams to act on real-time insights for faster, smarter decisions.
Why Growing Businesses Need Enterprise BI
What are the limitations of relying on Excel for scaling?
Many growing organizations continue using spreadsheets like Excel for reporting and analysis. That is understandable, Excel is familiar, inexpensive, and flexible. But as companies expand, these spreadsheets become siloed, error‑prone, and slow to update. When data lives in many files across departments, it is hard to get a single picture of the business.
In Egypt, businesses face this exact challenge, disconnected data, manual recalculations, and time‑consuming updates. These issues slow decision-making and raise risk of mistakes.
How does scattered data slow decision-making?
When information is scattered across departments such as finance, sales, operations, and logistics, management lacks a unified view. For example, if the sales team uses Excel, operations uses another tool, and finance uses monthly print‑outs, then the executive team has to reconcile manually. This delays insights and reduces agility.
By contrast, enterprise BI solutions enable unified dashboards, live data refreshes, and consolidated metrics, which means faster, better decisions. According to a market study, the Egyptian business intelligence market is projected to grow at a 13.7 % CAGR for 2025-2031.
That growth shows Egyptian companies recognize the limits of old tools and are moving to modern data platforms.
What Are Enterprise BI Solutions?
What are the key features of modern enterprise BI?
Enterprise BI, or business intelligence solutions, typically include:
Centralized data integration from multiple sources such as ERP, CRM, spreadsheets, and databases
Interactive dashboards and visualizations that update in near real-time
Self-service ability so non-technical users such as managers and team leads can explore data
Alerts and automation for key metrics, for example when monthly sales fall 10 percent
Scalable architecture, cloud or hybrid, to support growing data volumes and users
These features distinguish enterprise-grade systems from simply building more spreadsheets.
What is the difference between project-based dashboards and BI as a Service (BIaaS)?
Project-based dashboards: customized for a specific use case, for example a sales performance dashboard. They often require bigger upfront investment for design and integration
BIaaS (Business Intelligence as a Service): a subscription model where the vendor hosts the platform, handles updates and maintenance, and the client pays a recurring fee. The client gains access to dashboards, ongoing support, and continuous improvements
In Egypt and the wider MENA region, BIaaS is becoming more popular because it reduces upfront cost and infrastructure burden, making enterprise BI solutions more accessible for growing firms.
Steps to Transition from Excel to Enterprise BI
1. Assessing your current data landscape
Start by mapping where your data lives: spreadsheets, CRM, ERP, manual reports, and email attachments. Ask questions such as:
How many file versions exist
How many departments send reports manually
What is the time lag between data capture and decision
A clear inventory creates a baseline for improvement, even reducing one manual spreadsheet can free up hours of work each week.
2. Choosing the right BI tools for your business
Tool choice should match your business size, industry, and growth path. Key criteria:
Can it connect to your existing systems such as Excel, ERP, CRM
How easy is the dashboard to use for business users, not just analysts
Does it scale if you add more data sources
In Egypt the BI market is forecasted to expand, meaning more vendors and solutions will be available. Match your needs now and for the next 24 to 36 months.
3. Integrating multiple systems into one unified platform
Integration is the bridge between spreadsheets and enterprise BI. This might involve:
Migrating key data from Excel files into a central database or data warehouse
Connecting your ERP and CRM to the BI platform for automated data flow
Ensuring data definitions, for example Revenue or Cost of Goods Sold, are consistent across departments
When integration is done well, you can build dashboards that are refreshed daily or even hourly, not manually only at month end.
4. Training teams for adoption and data-driven decision-making
Technical rollout alone is not enough. To succeed you must build a data-driven culture:
Train business users how to interpret dashboards, not just view charts
Share success stories internally, when one team used the dashboard and reacted before a drop in sales
Encourage asking questions of the data, for example Why did this number fall, rather than accepting reports passively
This helps the shift from, here is the report, to, what should we do about it.
Common Challenges and How to Overcome Them
Data quality and consistency issues
When moving from Excel, businesses often discover messy data such as duplicate entries, inconsistent naming, or missing fields. These issues reduce trust in dashboards
Best practices include fixing data at source where possible, documenting data definitions, setting up automated data validation routines, and cleaning historical data in bulk when possible.
Resistance to change from teams
People comfortable with spreadsheets may resist new tools. Address this by:
Communicating benefits clearly, for example less manual work, faster insights
Involving end users early in dashboard design so they feel ownership
Offering quick wins, for example first dashboard for sales team that reduces weekly meeting prep from 3 hours to 30 minutes
Maintaining real-time reporting
Many firms aim for real-time dashboards but stumble on integration or data freshness. A phased approach works, start with daily updates, then move to near real-time when integration is stable. Set expectations accordingly.
Measuring the ROI of Enterprise BI
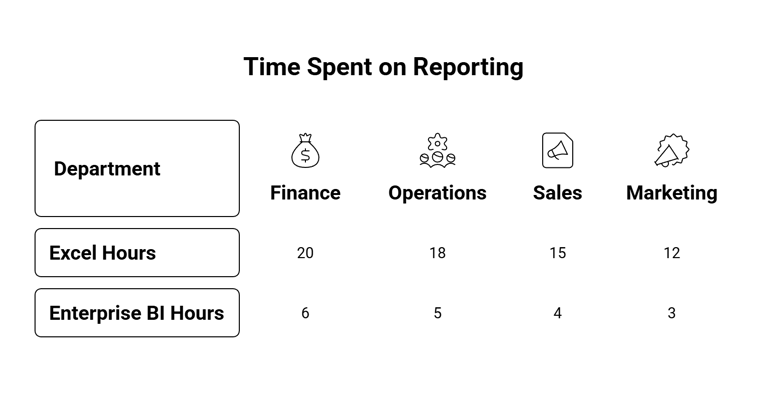
Time saved in reporting and analysis
By replacing manual spreadsheet consolidation with automated dashboards, companies often reduce weekly reporting time by 50 percent or more. While specific Egyptian numbers are scarce, globally BI adoption shows measurable productivity gains. For example, firms studied in Egypt found improved performance measurement systems after BI adoption.
Improvements in operational efficiency
Timely insights mean faster decisions, for example inventory replenishment, sales performance. In Egypt, the BI market growth forecast of 13.7 percent CAGR suggests firms are recognizing and investing in these efficiency gains. When dashboards show bottlenecks earlier, teams can act earlier and reduce cost or waste.
Enhanced insights for strategic decisions
Beyond operational gains, enterprise BI supports strategic choices such as market expansion, product line optimization, and customer retention. For growing Egyptian firms operating in the region, these insights matter for competing in MENA and internationally.

How Exology Helps
We design customized dashboards tailored to your company’s unique needs, enabling consolidated, live views across departments
We offer BIaaS subscription models, ideal for businesses in Egypt and the MENA region, with ongoing updates and support, reducing upfront cost
We integrate your existing tools such as Excel, ERP, and CRM into a unified platform, turning scattered data into actionable insights
We deliver training and consulting so your teams adopt a data-driven culture, interpret dashboards actively, and make smarter decisions
We support digital transformation efforts across Egypt, MENA, and beyond, helping you move from spreadsheets to enterprise-grade BI with minimal disruption
Read More
Contact us
Whether you have a request, a query, or want to work with us, use the form below to get in touch with our team.