
How to Choose the Right Business Intelligence Tool for Your Company
Find the best business intelligence tool for your company. Compare Power BI, Tableau, and Looker Studio with this expert guide to data analytics platforms.
BUSINESS INTELLIGENCE
Key Points
Align with your ecosystem: Choose a BI tool that integrates with your existing software, such as Microsoft 365 or Google Workspace, to simplify adoption.
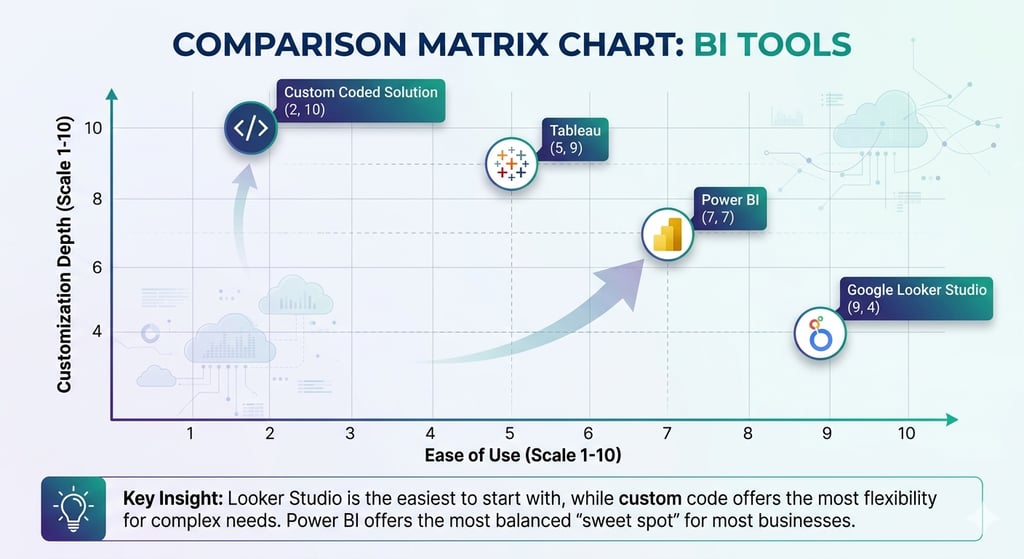
Power BI for Microsoft users: This tool is the most cost-effective and familiar option for businesses already relying on Excel and Azure.
Looker Studio for Google environments: Use this platform for fast, user-friendly reporting if your data primarily lives in Google Ads, Sheets, or BigQuery.
Tableau for complex data: Select Tableau for high-level visualizations and deep integration with Salesforce CRM data.
Custom-coded solutions for flexibility: Build a custom tool to gain total ownership of your data logic and eliminate recurring per-user licensing fees.
Prioritize ERP integration: Ensure your chosen platform connects natively to systems like Odoo or SAP to maintain a single source of truth.
Actionable takeaway: Audit your current data sources and team technical skills before purchasing a license to ensure the tool fits your specific business workflow.
Selecting a business intelligence tool often feels like a high-stakes guessing game. With so many platforms on the market, how do you know which one fits your specific needs? At Exology, we believe that a good BI project is defined by picking the right tools for the job. We are not defined by a certain tool or platform. Instead, we pick the right tools for your unique requirements. We have delivered over 200 projects worldwide across 20 countries. This experience has taught us that every business has a unique data DNA.
Choosing the wrong tool can lead to expensive delays and wasted resources. Research shows that poor data quality costs organizations an average of $12.9 million per year. This cost often stems from using tools that do not integrate well with existing systems. In this guide, we will break down the most popular BI tools. We will help you decide which one is best for your business.
Why does the right tool choice matter for your bottom line?
The goal of business intelligence is to turn raw data into action. If your team spends more time fighting with the software than analyzing results, the tool is failing you. Research shows that office workers average just 2 hours and 53 minutes of focused work per 8-hour shift. A well-chosen BI tool automates the gathering and cleaning of data. This allows your team to focus on making decisions that drive growth.
Using a mismatched tool also creates hidden labor costs. Manual reporting can waste hours of time every week. By selecting a tool that fits your current workflow, you eliminate these inefficiencies. You also reduce the risk of human error that comes with manual data entry. Organizations that implement robust data tools can recover significant portions of lost value through systematic improvements.
How does your existing ecosystem affect your choice?
One of the most important factors in choosing a tool is your current digital ecosystem. Most businesses already use a specific set of tools for email, storage, and communication. Integrating your BI platform into this existing family of software makes adoption much easier.
Is the Microsoft ecosystem your home base?
If your company uses Outlook for email, Teams for meetings, and Excel for daily tasks, Power BI is usually the best choice. Power BI was built to work perfectly with Microsoft 365. It feels familiar to anyone who has used Excel before. This reduces the time your staff needs for training.
Power BI is also highly affordable for many businesses. Power BI Pro costs $14 per user per month. Because it integrates with Azure, it can handle data from almost any Microsoft source with a single click. We often recommend Power BI for its rapid deployment and seamless connection to the tools your team already loves.
Does your business run on the Google ecosystem?
Many modern companies prefer the Google Workspace environment. They use Gmail, Google Drive, and Google Meet for daily operations. In this case, Google Looker Studio is often the most natural fit. It connects directly to Google Sheets, Google Ads, and BigQuery without any complex setup.
Looker Studio is excellent for smaller teams or marketing departments. It provides a user-friendly way to visualize data without needing a deep technical background. While it may be less powerful than Power BI for complex data modeling, it is the most accessible option for companies that want quick insights within the Google cloud.
Do you rely heavily on Salesforce?
If your sales team lives in Salesforce, Tableau is a strong contender. Salesforce acquired Tableau to give its users deep, visual insights into their customer data. Tableau is famous for its beautiful and highly customizable visualizations. It can handle massive datasets that might slow down other platforms.
Tableau is often more expensive and has a steeper learning curve than Power BI. However, its ability to blend data from many different sources is unmatched. It is the gold standard for organizations that need to tell complex stories through data. As of 2026, Tableau holds roughly an 17.75% market share in the Business Intelligence category.

Which data source are you connecting to?
Your choice of BI tool must also depend on where your data lives. Different platforms have different connectors. These connectors allow the tool to pull information from other software. Before you buy a license, you must identify your primary data sources.
Connecting to SQL and Excel
Most businesses start with data in SQL databases or simple Excel spreadsheets. Almost every major BI tool handles these sources well. However, Power BI remains a favorite for Excel users. It allows you to turn a static spreadsheet into a live, interactive dashboard in minutes. If your data is stored in local SQL servers, Power BI’s gateway feature makes it easy to keep your reports updated in real time.
Connecting to ERP systems like Odoo, SAP, or Oracle
Enterprise Resource Planning (ERP) systems hold the most valuable data in a company. Whether you use Odoo, SAP, or Microsoft Dynamics, your BI tool must be able to talk to your ERP. For example, if you use Microsoft Dynamics, Power BI is the clear winner due to native integration.
If you use Odoo, you might need a more flexible approach. While Power BI can connect to Odoo via an API or a direct database connection, some businesses prefer a custom approach to handle Odoo’s unique data structure.
Connecting to Salesforce and other CRMs
If your primary data source is a Customer Relationship Management (CRM) tool like Salesforce, you need a BI tool with strong API capabilities. Tableau was built specifically to work with Salesforce data. It allows for deep exploration of sales pipelines and customer behavior. Other tools like Power BI can also connect to Salesforce, but Tableau often provides a more native experience for sales-heavy organizations.
When should you consider GoodData?
Some businesses need more than just internal dashboards. They might want to share data with their own clients. They might want to embed charts directly into their software products. This is where GoodData shines. GoodData is an enterprise platform focused on governed and embedded analytics.
Exology has a strategic partnership with GoodData. We use this platform when a client needs a white-label solution. A white-label solution allows you to put your own branding on the dashboards. This makes them look like part of your own product. GoodData is excellent for maintaining a single source of truth across many different departments or external partners. It provides strong security and governance. This ensures that people only see the data they are allowed to see.
When is a custom-coded visualization the best option?
Sometimes, off-the-shelf tools like Power BI or Tableau are not enough. You might have a highly specific way of looking at your business. You might need a unique interface that standard tools cannot provide. In these cases, creating a fully custom visualization using code is the best route.
A custom tool offers complete flexibility. You are not limited by the templates or features of a big software provider. While the initial cost of building a custom tool is higher, the long-term ROI can be better. You do not have to pay monthly licensing fees for every user. You also have total ownership of the code and the logic behind your data. This is a future-proof approach for companies with proprietary processes that a standard tool cannot capture.
Frequently Asked Questions
Which BI tool is the easiest to learn?
Google Looker Studio is generally considered the easiest for beginners. It uses a drag-and-drop interface that feels very much like making a Google Slide. Power BI is also very accessible for people who are already comfortable using Excel functions and pivot tables.
Is Power BI better than Tableau?
There is no single better tool. Power BI is usually better for cost and Microsoft integration. Tableau is usually better for advanced data scientists who need to create very specific, complex visuals. At Exology, we evaluate your specific goals before recommending either one.
Can I use multiple BI tools at once?
Yes, many large companies use different tools for different departments. For example, a marketing team might use Looker Studio for quick ad reports. The finance team might use Power BI for deep financial modeling. However, this can lead to data silos. We recommend having a clear strategy to keep your data consistent across all platforms.
How do I know if I need a custom-coded tool?
If you find yourself saying "I wish the tool could do this" and finding no solution in the settings, you might need a custom tool. Custom tools are also great if you want to avoid per-user licensing fees as your company grows to hundreds of employees.
How Exology Helps
Exology specializes in turning complex data into clear, actionable insights. We do not just sell software. We build solutions that help you grow. Our expertise comes from working across 10 key industries and delivering over 200 successful projects. We are tool-agnostic. This means we pick the platform that fits your business, not the other way around.
Here is how we can help you solve your data challenges:
Expert Tool Selection: We analyze your existing ecosystem and data sources to recommend the most cost-effective BI platform for your team.
ERP and Data Integration: We have deep experience connecting BI tools to systems like Odoo, SAP, and Oracle. We ensure your data flows seamlessly from your operations to your dashboard.
Saving Time and Resources: In 2025 alone, Exology saved our clients over 5,000 hours of manual work by automating their reporting processes.
Proven Global Success: With over 150 projects delivered worldwide, we bring international best practices to companies in Egypt, across the MENA region, and internationally.
Handling Massive Scale: Our systems processed over 10 million data rows in 2025. This proves that we can help your business grow without your data tools slowing you down.
Read More
Contact us
Whether you have a request, a query, or want to work with us, use the form below to get in touch with our team.