
Why Your Team Ignores Your Dashboards: Strategies for Improving BI Adoption
Stop wasting money on dashboards nobody uses. Learn proven BI adoption strategies to help your non-technical team make better, data-driven decisions.
BUSINESS INTELLIGENCE
Key Points
Many businesses fail to see a return on BI investments because teams continue to rely on manual spreadsheets.
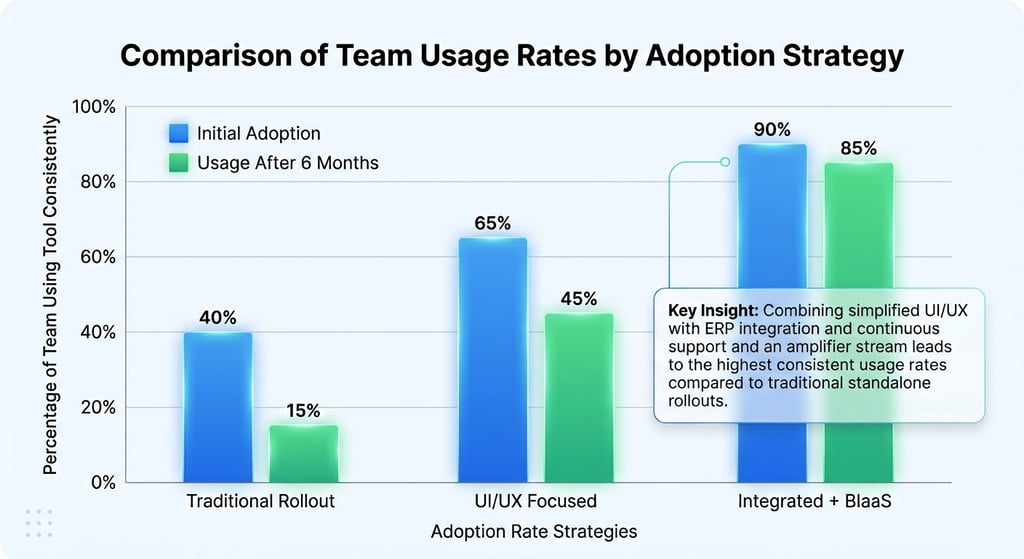
Non-technical users often ignore dashboards due to excessive data complexity and poor visual design.
Building trust in data requires a single source of truth to avoid conflicting numbers between different departments.
High adoption rates occur when you embed analytics directly into the daily workflows of ERP and CRM systems.
Successful data projects prioritize actionable strategic insights over vanity metrics that do not drive decisions.
Ongoing support through a BIaaS model ensures that dashboards remain relevant as the business grows and changes.
Actionable takeaway: Integrate one high-value metric into your team’s primary software to solve a specific and recurring daily problem.
The frustration is common among modern business leaders. You invest thousands in advanced Business Intelligence solutions and hire experts to build complex charts. However, a month later, you realize your team is still using old spreadsheets to make their most important decisions. This "dashboard abandonment" is a global challenge that costs companies time and capital.
At Exology, we have seen this problem firsthand through our work on over 200 projects for more than 150 businesses across 20 countries. We have helped companies in 10 key industries move from data confusion to data clarity. We have learned that if your team is ignoring your dashboards, it is usually not a lack of effort. It is because the tools do not fit their daily needs. This post explores why adoption fails and how to fix it with strategies backed by real world data.
Why do non-technical teams struggle with BI tools?
Is the data too complex for the average user?
Most non-technical employees feel overwhelmed by what we call "data vomit." This happens when a dashboard shows every possible metric at once without a clear hierarchy. When a user has to hunt for a single answer among fifty charts, they will likely give up and return to their familiar routines.
According to research from Gartner, organizations will abandon 60% of AI and data projects by 2026 if they are not supported by clear, AI-ready data and proper literacy. If your team cannot interpret a chart in under five seconds, the dashboard has failed its primary purpose.
Is there a lack of trust in the numbers?
If a department head sees a number that looks incorrect, they will lose faith in the entire system. Inconsistent data often occurs when different departments use different definitions for the same metric. Building trust requires a single source of truth that reflects the actual reality of the business operations.
Is the tool too far away from their daily work?
Forcing a new platform on your staff rarely works if it feels like a separate chore. If an employee has to log out of their ERP or email to check a dashboard, they simply will not do it. High adoption happens when data meets the user where they already spend their time.
How can businesses simplify data for non-technical users?
Why is UI/UX design critical for dashboard adoption?
At Exology, we believe that data must be beautiful to be useful. Many BI tools are built by technical experts for other technical experts. This leads to cluttered interfaces that look intimidating. We focus on professional UI/UX design to make dashboards that are easy to read and good for the eye.
When a dashboard is visually intuitive, the "fear of data" disappears. Users feel empowered when they can navigate a screen without a manual. This is why our approach starts with a deep understanding of the user interface. We prioritize clean layouts, high-contrast alerts, and a logical flow of information.
How do you separate vanity metrics from strategic insights?
The first step in our approach at Exology is understanding your specific business. Many companies fall into the trap of tracking "vanity metrics." These are numbers that look good on paper but do not help you make a decision. For example, knowing your total website hits is interesting, but knowing which specific product category is losing margin is actionable.
McKinsey research shows that data-driven organizations are 23 times more likely to acquire new customers and 19 times more likely to be profitable. We help you identify the specific insights that drive growth rather than just filling a screen with pretty but useless numbers.
What role does integration play in consistent tool usage?
Should your BI tool talk to your ERP and CRM?
One of the biggest barriers to adoption is "platform fatigue." Your team is already busy managing tasks in their ERP or updating leads in their CRM. Adding another login is often the breaking point. This is why we specialize in integrating data directly with the systems your business already uses, such as Odoo, Salesforce, or Microsoft Dynamics.
When a sales rep can see their performance metrics inside their CRM, they use them. When an inventory manager sees real-time stock alerts inside their ERP, they take action. Integration turns a dashboard from a "destination" into a "companion."
Why being tech-agnostic matters for adoption?
Every business has a unique data ecosystem. Some rely on cloud-based tools, while others need on-premise solutions. Exology does not rely on just one tool or technology. We use whichever platform works best for your specific business goals. Whether it is Power BI, Tableau, or custom AI agents, the goal is the same: making sure the technology serves the people, not the other way around.
How can you improve data literacy across the organization?
Do teams need formal training to use BI tools?
While intuitive design reduces the need for heavy training, a baseline of data literacy is still essential. Gartner reports that 83% of Chief Data Officers are now implementing data literacy programs to bridge the gap between executive expectations and employee skills.
We suggest a "show, don't just tell" approach. Instead of long lectures, provide short, interactive sessions that show how the data solves a specific problem the team faced that week. When employees see that data saves them time, their willingness to learn increases.
Who are your "Data Champions"?
In our experience across 20+ countries, we have found that adoption is social. Identify individuals in sales, HR, or operations who are naturally comfortable with technology. Train them to be your internal champions. When a non-technical staff member has a question, they are more likely to ask a trusted colleague than a distant IT department.
Can Business Intelligence as a Service (BIaaS) solve long-term issues?
Why is static implementation a recipe for failure?
Business moves fast. A dashboard that was perfect six months ago might be irrelevant today. If the tool does not evolve with the business, users will stop looking at it. This is why many companies are moving toward a BIaaS model.
Our BIaaS model provides ongoing support, updates, and dashboard refinements. It ensures that as your company expands into new markets or launches new products, your data tools remain accurate and useful. This continuous evolution is what keeps adoption rates high over the long term.
How does expert consulting reduce the risk of failure?
Many businesses try to build their data infrastructure alone. This often leads to "technical debt" and tools that nobody uses. By working with consultants who have made over 150 consultations, you avoid the common pitfalls. Experts bring a global perspective from different industries, ensuring your strategy is world-class from day one.

How Exology Helps
Exology understands that Business Intelligence is about people as much as it is about numbers. We have seen these adoption problems firsthand, and we have the expertise to help your business turn information into consistent action. We work with companies globally to build data systems that teams actually enjoy using.
Expertise Built on Experience: With over 150 projects delivered worldwide, we bring proven strategies to every engagement.
Efficiency at Scale: In 2025 alone, we saved our clients over 5,000 hours of manual work by automating complex data processes.
Massive Data Handling: Our systems processed more than 10 million data rows in 2025, ensuring that even the largest datasets are turned into clear insights.
Strategic Financial Impact: Our data-driven interventions are powerful. We were once able to save a client $130,000 in a single day by identifying a critical operational leak.
Seamless Integration: We eliminate platform fatigue by integrating your analytics directly with the ERPs and CRMs your team uses every day.
UI/UX Excellence: We do not just build charts. We design easy-to-read, visually appealing dashboards that remove the technical barriers for your non-technical staff.
Read More
Contact us
Whether you have a request, a query, or want to work with us, use the form below to get in touch with our team.