
10 Key Features Every Analytics Dashboard Should Have
Discover the 10 essential features every analytics dashboard should include to turn complex data into clear, actionable insights, improve decision-making, and support stronger business growth across teams.
BUSINESS INTELLIGENCE
Key Points
An analytics dashboard is a visual, interactive interface that consolidates data from multiple sources, turning raw data into actionable insights.
Unlike static reports, dashboards update in real-time, allow filtering and drill-downs, and support data-driven decision-making.
Essential features include real-time updates, customizable views, interactive visualizations, KPI tracking, alerts, and clean layout.
Advanced dashboards integrate data from all systems, are mobile-accessible, secure, and support collaboration and sharing.
AI-powered and predictive analytics transform dashboards into proactive decision-support tools.
Exology builds fully customized dashboards for businesses, integrating data, ensuring usability, enabling AI insights, and supporting ongoing management via BIaaS.
Actionable takeaway: Use dashboards to centralize data, monitor KPIs, detect trends early, and enable faster, informed business decisions.
What Is an Analytics Dashboard?
An analytics dashboard is a digital interface that gathers data from different sources and shows it in a visual, easy-to-understand way. Instead of scrolling through spreadsheets or reading long reports, decision makers can see charts, numbers, and trends at a glance. Well-designed dashboards turn raw data into insight, helping companies spot opportunities or problems fast.
Unlike traditional reports that often come as static tables or periodic summaries, dashboards are dynamic, update automatically, let users filter or “drill down” into details, and present data visually. This makes them far more flexible and actionable.
Why Features Matter in an Analytics Dashboard
Dashboards are only useful if they are designed wisely. The right features ensure users actually understand the data quickly and make better decisions. A dashboard lacking clarity, flexibility, or integration can confuse users or hide important insights.
A good dashboard helps build a data-driven culture. Teams rely on shared dashboards to stay aligned, track performance, and act proactively, rather than working from outdated or incomplete information. Without essential features, dashboards risk becoming unused digital clutter or misleading decision tools.
Feature 1 – Real-Time Data Updates
One of the most powerful capabilities of an analytics dashboard is real-time, or near-real-time, data updates. This means the dashboard reflects the latest data as it becomes available. For example:
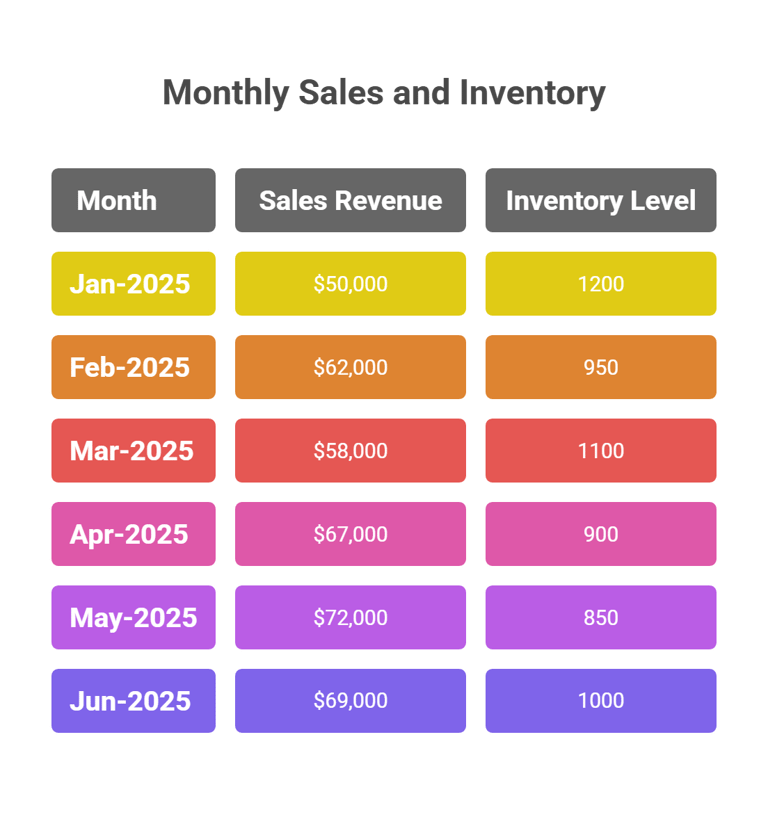
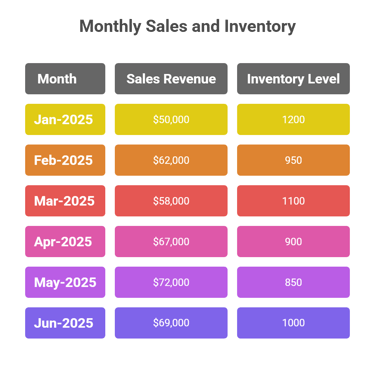
In a retail setting, sales, inventory, or customer orders can update continuously, letting managers react to changes immediately
In operations or production, real-time dashboards can flag slowdowns or bottlenecks as soon as they appear, enabling quick corrective action.
This immediacy supports speed and agility. When market or internal conditions shift fast, real-time dashboards give teams the clarity to respond rather than wait for periodic reports.
Feature 2 – Customizable Views
Not all users need the same information. Executives, operational managers, finance teams, or marketing specialists each care about different metrics. A good dashboard lets users customize what they see.
Custom views, filters, and role-based dashboards help:
Show relevant KPIs per user role
Focus on what matters to each function or team
Avoid “dashboard overload” by hiding irrelevant data
Customizable dashboards improve usability and adoption. They ensure that each stakeholder sees actionable data, not a flood of metrics that do not matter.
Feature 3 – Interactive Visualizations
Visuals like bar charts, line graphs, heatmaps, trend lines, or gauges help turn numbers into stories. Analytics dashboards should offer a variety of visualization options and let users interact with them.
Interactivity may include:
Drill-downs, clicking on a high-level chart to see deeper details.
Filters and slicers, adjusting time periods, regions, or segments to focus on subsets of data.
Tooltips or hover info, showing exact values, context, or explanations without cluttering the view.
These interactive elements make dashboards a powerful analytical tool. Analysts or non-technical users alike can explore data, uncover patterns, and understand trends without needing to export to spreadsheets or write queries.
Feature 4 – Clean and Easy-to-Read Layout
Clarity matters. A good dashboard avoids crowding too many visuals or numbers on one screen. Instead:
Display critical KPIs and summary metrics at the top or front
Group related data logically
Use consistent fonts, spacing, and colors
Keep a clean visual hierarchy so the user’s attention goes to the most important insights first.
Overloading a dashboard can make it confusing. Simplicity helps decision makers quickly grasp what matters and act without hesitation.
Feature 5 – KPI Tracking and Alerts
Dashboards should be more than passive screens. They need to track key performance indicators (KPIs) and alert users when something needs attention.
With KPI tracking and alerting, teams can:
Monitor performance against goals, such as sales targets, production capacity, or customer churn
Get notified when metrics cross thresholds, for example inventory low, sales drop, or costs exceed budget
Respond proactively rather than discovering issues late
This adds a layer of operational intelligence, helping businesses stay ahead and respond quickly.
Feature 6 – Data Integration Across Systems
Most businesses use multiple systems, such as ERP, CRM, marketing tools, finance spreadsheets, or external data feeds. A powerful analytics dashboard must integrate data from these sources and present a unified view.
Integration means:
Pulling data from internal databases, external platforms, spreadsheets, or cloud tools
Cleaning and transforming data so metrics are comparable and reliable
Presenting a single source of truth for stakeholders
This unified view helps avoid data silos, reduces manual aggregation, and simplifies decision processes.
Feature 7 – Mobile Accessibility and Responsive Design
Executives, sales teams, or field staff often need access to dashboards while on the move. Dashboards should adapt to different devices, including desktop, tablet, or mobile.
A responsive design ensures:
Data remains readable and accessible on smaller screens
Users can check KPIs, trends, or alerts from anywhere
Faster decision-making even outside office hours or while traveling
This flexibility supports real-time responsiveness and ensures data stays actionable no matter where users are.
Feature 8 – Security and Access Control
Business data is sensitive. Dashboards often show financials, sales, customer info, or operational performance. Security and access control are crucial.
Good dashboards should offer:
Role-based access so each user sees only what is relevant to them
Ability to manage permissions, such as editing rights, view-only access, or restricted segments
Audit trails or logs to track changes and data access
This ensures sensitive data stays protected and compliance requirements are met while allowing different teams to use the dashboard safely.
Feature 9 – Collaboration and Sharing Capabilities
Data insights matter only if the right people see them. A dashboard should support collaboration and sharing. Features might include:
Shared access across teams or departments
Exporting reports or visualizations, such as PDF, images, or CSV, for presentations or meetings
Commenting, annotations, or notes on data points
Scheduled reports or automated distribution of dashboards to stakeholders
These features turn dashboards into tools not just for insight, but for cross-team alignment, transparency, and coordinated action.
Feature 10 – Predictive and AI-Powered Analytics
Beyond showing past and current data, advanced dashboards now offer predictive insights and AI-powered analytics. This feature helps businesses anticipate trends, forecast performance, and make proactive decisions.
With predictive analytics and AI, dashboards can:
Forecast future sales, demand, or resource needs based on historical data
Detect anomalies or risks before they escalate
Provide recommendations or insights, helping managers act strategically rather than reactively.
This capability turns dashboards from passive reporting tools into active decision-support engines.
How Exology Helps
We build fully customized analytics dashboards tailored to your business data, KPIs, and decision-making needs
We integrate data from all your systems, including ERP, CRM, spreadsheets, and external sources, into one unified dashboard for clarity and efficiency
We design dashboards with user-friendly layouts, interactive visualizations, mobile access, and secure role-based permissions so everyone gets the right insights
We enable real-time data updates, KPI tracking, alerts, and AI-powered analytics so your team responds quickly and plans proactively
Whether you need a one-time setup or ongoing dashboard management through our BIaaS offering, we support companies in Egypt, across MENA, and internationally
Read More
Contact us
Whether you have a request, a query, or want to work with us, use the form below to get in touch with our team.