
10 Marketing Dashboard KPIs Every Business Should Track
Discover the 10 marketing dashboard KPIs every business should track to improve visibility, ROI, and faster decision making. see how exology can help with your marketing dashboard
BUSINESS APPLICATIONSBUSINESS INTELLIGENCE
Key Points
Marketing dashboards centralize data from multiple platforms into one clear view
KPIs connect marketing activities to real business outcomes and revenue
Core KPIs include traffic, conversion rate, CPL, CAC, ROMI, and revenue influenced by marketing
Channel and engagement metrics guide budget allocation and content optimization
Funnel and lead quality KPIs reveal friction points and sales readiness
Regular real time, weekly, and monthly reviews enable faster and better decisions
Actionable takeaway: Build a focused marketing dashboard with a limited set of KPIs that align directly with your growth and revenue goals
Why Marketing Dashboards Are Important
Marketing teams operate in a world full of data. Every campaign generates clicks, views, conversions, costs, and revenue information. Without marketing dashboards, this data stays scattered across platforms like social media, Google Analytics, email tools, and ad networks. Dashboards pull all of that together in one place to show you what’s working, what’s not, and where to focus next. They give teams real time visibility into performance and offer a shared foundation for decision making, alignment, and accountability. A well-designed marketing dashboard helps teams make faster decisions based on data rather than intuition and reduces the time spent preparing manual reports.
Understanding which KPIs to include on your dashboard is essential. The right mix of metrics helps your marketing team stay focused on growth, show impact to leadership, and optimize campaigns proactively.
What Is a Marketing Dashboard and Why Do KPIs Matter?
Marketing dashboards are tools that display key performance indicators in one view so teams can quickly assess how marketing activities are performing. KPIs matter because they connect activity to outcomes. They tell you whether your campaigns are reaching the right audience, generating demand, converting prospects, and driving revenue. Without KPIs, you’re left guessing at performance instead of measuring it in real time.
Dashboards differ from reports in that they are dynamic and continuously updated. Reports capture a snapshot in time, while dashboards show trends as they happen.
KPI 1: Website Traffic
What it measures: The total number of visitors to your website.
Why it matters: Traffic is the foundation of most marketing goals. More visitors generally mean more opportunities for conversions and revenue. Website traffic is considered one of the most fundamental marketing KPIs across industries.
KPI 2: Traffic by Channel
What it measures: Breakdown of traffic by source such as organic search, social, paid, and referral.
Why it matters: Knowing where your visitors come from helps teams allocate budget and effort to channels that deliver the best value.
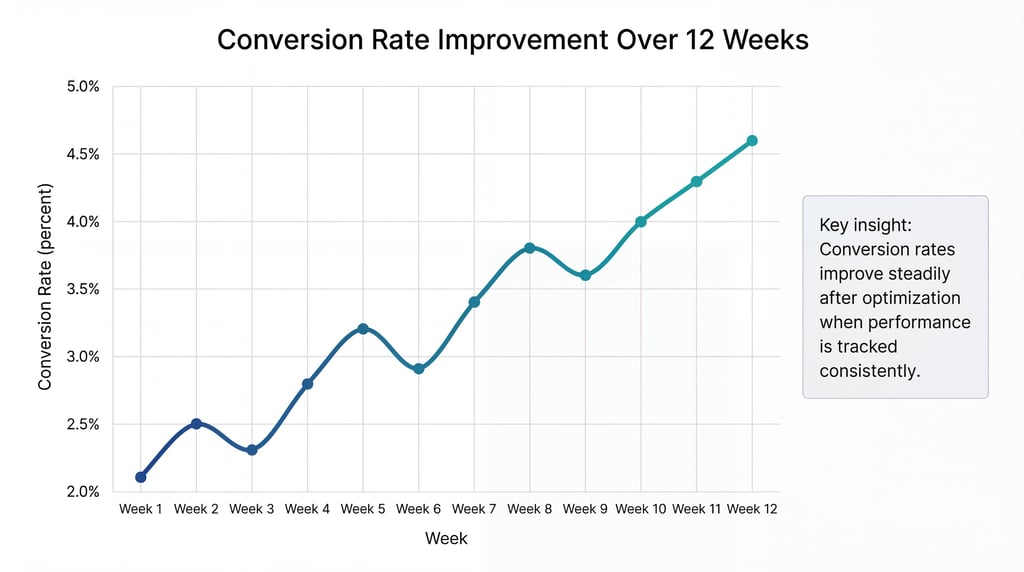
KPI 3: Conversion Rate
What it measures: The percentage of visitors who take a desired action such as a form submission, signup, or purchase.
Why it matters: Conversion rate shows how effective your site or campaign is at turning visitors into leads or customers. Industry benchmarks vary by channel and industry, making trend improvement more important than isolated averages.
KPI 4: Cost per Lead (CPL)
What it measures: Total marketing spend divided by the number of leads generated.
Why it matters: CPL reveals the efficiency of your campaigns. Lower CPL indicates stronger performance relative to cost.
KPI 5: Marketing Qualified Leads (MQLs)
What it measures: Leads that meet predefined criteria indicating a higher likelihood of conversion.
Why it matters: MQLs help separate lead volume from lead quality. Tracking MQLs improves alignment between marketing and sales teams by focusing on readiness rather than quantity.
KPI 6: Customer Acquisition Cost (CAC)
What it measures: The total cost required to acquire a new customer through marketing activities.
Why it matters: CAC directly connects marketing spend to revenue outcomes and long term profitability.
KPI 7: Return on Marketing Investment (ROMI)
What it measures: Revenue generated from marketing minus marketing spend, divided by marketing spend.
Why it matters: ROMI is one of the most important metrics for leadership because it shows whether marketing is creating financial value.
KPI 8: Engagement Rate
What it measures: Interaction levels such as clicks, likes, comments, and shares across platforms.
Why it matters: Engagement reflects how well your message resonates with your audience. Engagement metrics are widely used to evaluate content performance and predict future conversion potential.
KPI 9: Funnel Drop Off Rate
What it measures: The percentage of users who exit the funnel at each stage.
Why it matters: This KPI highlights friction points that prevent prospects from moving forward.
KPI 10: Revenue Influenced by Marketing
What it measures: Revenue from deals where marketing activity contributed to the customer journey.
Why it matters: This KPI ties marketing activity directly to business outcomes and builds trust with leadership.
How Often Should Marketing Dashboard KPIs Be Reviewed?
Marketing dashboards should update in real time or near real time to support fast decisions. Weekly reviews help teams adjust campaigns quickly, while monthly reviews support strategic planning and performance evaluation.
Common Mistakes to Avoid When Tracking Marketing Dashboard KPIs
Tracking too many KPIs can reduce clarity and slow decision making.
Using disconnected data sources leads to inconsistent reporting.
Ignoring data accuracy undermines trust in the dashboard.
Lack of clear KPI definitions causes confusion across teams.
How Exology Helps
Exology designs marketing dashboards that turn scattered data into clear, actionable insight.
We build custom dashboards that reflect your real marketing goals and KPIs.
Our solutions automate reporting and reduce manual work across teams.
In 2025, Exology helped clients save 5,000+ hours of manual work and process 10M+ data rows across marketing dashboards.
Exology has delivered 150+ projects worldwide across 10 key industries, supporting companies in Egypt, across the GULF region, and internationally in Europe and USA.
Our dashboards support marketers and executives with role based views and reliable data.
Read More
Contact us
Whether you have a request, a query, or want to work with us, use the form below to get in touch with our team.