
How to Prepare Data for Analysis: 10 Practical Steps Businesses Should Follow
Learn how to prepare data for analysis with 10 practical steps that improve reporting accuracy, dashboard performance, and business decisions.
DATA ANALYTICS
Key Points
Data preparation is essential for accurate analytics and better business decisions
Poor-quality data can lead to reporting errors, inconsistent KPIs, and unreliable dashboards
Businesses should define clear goals and KPIs before collecting or analyzing data
Cleaning duplicate, missing, and inconsistent data improves reporting accuracy and trust
Integrating data from multiple systems creates a stronger foundation for analytics and BI
Automating data preparation reduces manual work, reporting delays, and operational inefficiencies
Actionable takeaway: Audit your current data sources, clean inconsistent records, and standardize formats before building reports or dashboards
Businesses generate massive amounts of data every day. Sales records, ERP systems, CRM platforms, spreadsheets, operations logs, customer interactions, and marketing reports all produce information that could help teams make better decisions.
But raw data alone is not useful.
Before businesses can build dashboards, track KPIs, forecast performance, or use AI effectively, they first need to prepare their data properly.
Data preparation is one of the most important stages in analytics. If the data is incomplete, duplicated, outdated, or inconsistent, the analysis becomes unreliable. Even advanced dashboards and AI systems can produce misleading insights when built on poor-quality data.
According to an IBM report on poor data quality, bad data costs businesses trillions of dollars globally every year through operational inefficiencies, reporting errors, and poor decisions.
This is why successful analytics projects spend significant time preparing and organizing data before analysis begins.
At Exology, we have seen this directly across real business environments. Exology has completed 200+ projects for 150+ businesses across 20+ countries and 10+ key industries. One of the biggest patterns across successful projects is simple:
The quality of the analysis depends heavily on the quality of the preparation process.
Why Is Data Preparation Important Before Analysis?
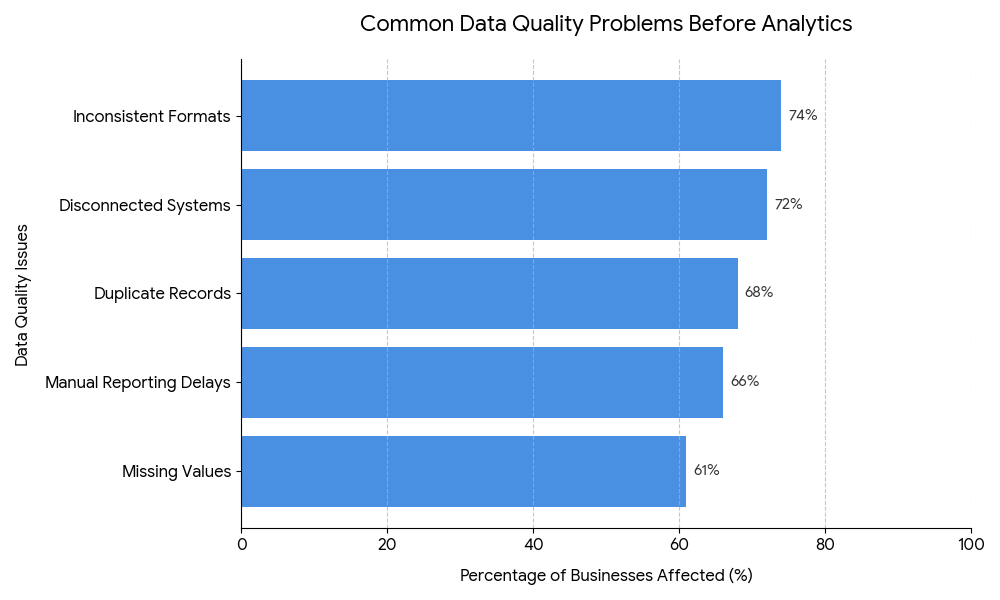
Poor data leads to poor decisions
Analytics systems are designed to identify patterns and trends. If the underlying data is inaccurate, the output becomes inaccurate too.
For example:
Duplicate customer records can inflate sales metrics
Missing operational data can hide performance problems
Inconsistent naming structures can break reports
Outdated spreadsheets can create conflicting KPIs
This creates confusion instead of clarity.
Clean data improves reporting accuracy
According to Experian’s global data management research, many businesses believe poor data quality directly affects customer experience, operational efficiency, and strategic decision-making.
Clean and organized data helps businesses:
Build accurate dashboards
Improve forecasting
Reduce manual reporting work
Trust their KPIs
Make faster decisions
Data preparation reduces reporting delays
Many companies still spend hours manually preparing spreadsheets before meetings or reports.
A McKinsey report on data-driven organizations explains that businesses that improve data accessibility and management are significantly more likely to improve operational efficiency and decision-making speed.
When data preparation is structured properly, reporting becomes faster and more reliable.
What Happens When Businesses Skip Data Preparation?
Inconsistent KPIs and duplicate reports
Different departments often calculate the same KPI differently.
For example:
Finance may define revenue differently from sales
Marketing may count leads differently from operations
Teams may rely on different spreadsheet versions
Without standardized preparation, reports become inconsistent.
Manual reporting becomes slow and unreliable
Teams waste time:
Copying data manually
Fixing spreadsheet errors
Searching for missing records
Comparing conflicting reports
This slows decision-making.
Teams lose trust in dashboards
When dashboard numbers constantly change or conflict with reality, employees stop using the system.
Trust is critical in analytics.
1. Define the Business Goal Before Touching the Data
Start with the decision you want to improve
Data preparation should begin with a business objective.
Ask questions like:
What problem are we solving?
What decision should this analysis support?
What KPIs matter most?
Without clear goals, teams often collect unnecessary data that complicates reporting.
Identify the KPIs that matter
The required data depends on the metrics being tracked.
Examples:
Customer retention analysis needs customer history data
Inventory analysis requires operational and supply chain data
Financial reporting depends on structured accounting records
Clear KPIs help teams focus only on relevant data.
2. Collect Data From All Relevant Sources
Common business data sources
Most organizations store data across multiple systems:
ERPs
CRMs
Excel spreadsheets
Accounting software
Cloud platforms
SQL databases
Marketing platforms
Important information is often fragmented.
Why disconnected systems create blind spots
When systems are disconnected:
Teams see incomplete reports
Departments operate separately
Leadership lacks a full operational view
Connecting systems creates a stronger foundation for analytics.
3. Remove Duplicate and Irrelevant Data
Common duplication issues
Duplicate records are extremely common in business data.
Examples include:
Repeated customer profiles
Duplicate invoices
Multiple entries for the same transaction
Old spreadsheet copies
These duplicates distort analysis.
How duplicate data affects analytics
Duplicate records can:
Inflate revenue numbers
Distort customer counts
Mislead forecasting models
Create dashboard inaccuracies
Removing unnecessary data improves reliability significantly.
4. Standardize Formats and Naming Conventions
Date formats, currencies, and naming structures
Businesses often use inconsistent formats across systems.
Examples:
DD/MM/YYYY vs MM/DD/YYYY
USD vs EUR
“Sales Team” vs “Sales Dept”
Different product naming structures
These inconsistencies break reports and calculations.
Why consistency matters for dashboards
Standardization improves:
Data matching
Dashboard performance
Filtering and grouping
Reporting accuracy
It also simplifies future integrations.
5. Handle Missing Data Properly
Identify missing values early
Missing data is normal in business operations.
However, businesses must identify:
Which fields are missing
Why the data is missing
Whether the missing values affect decisions
Decide whether to remove, replace, or investigate
Different situations require different approaches:
Some records should be removed
Some values can be estimated
Some gaps require operational fixes
Ignoring missing data creates unreliable analysis.
6. Validate Data Accuracy
Cross-check against source systems
Businesses should compare prepared datasets against original systems.
Validation helps identify:
Incorrect calculations
Import errors
Mapping problems
Missing transactions
Build validation rules
Examples of validation rules:
Revenue cannot be negative
Dates must follow a standard format
Customer IDs must be unique
Validation improves trust in reporting systems.
7. Organize Data Into a Clear Structure
Use tables, categories, and relationships
Good analytics requires organized structures.
This includes:
Logical table relationships
Categorized datasets
Clear hierarchies
Structured dimensions and measures
Build a single source of truth
A centralized structure helps everyone work from the same numbers.
This reduces:
Reporting conflicts
Spreadsheet dependency
Department silos
8. Integrate Data Across Departments
Connect finance, sales, operations, and marketing
Analytics becomes more powerful when departments are connected.
For example:
Sales data combined with operations data reveals fulfillment trends
Marketing data combined with finance data improves ROI analysis
Integrated systems improve visibility.
Improve visibility across the business
Leadership teams need a complete operational picture.
Connected data enables:
Faster decision-making
Better forecasting
Stronger operational coordination
9. Automate the Data Preparation Process
Reduce manual work and reporting delays
Manual preparation consumes significant time.
Automation helps businesses:
Refresh reports automatically
Reduce spreadsheet work
Improve consistency
Minimize human error
According to a Deloitte automation insights report, organizations continue increasing investment in automation because of efficiency improvements and reduced operational friction.
Use ETL pipelines and workflow automation
ETL stands for:
Extract
Transform
Load
These pipelines automatically move and prepare data between systems.
Automation tools can also:
Trigger alerts
Clean datasets
Validate records
Refresh dashboards
10. Continuously Monitor and Improve Data Quality
Data preparation is not a one-time task
Businesses constantly generate new data.
Without ongoing monitoring:
Errors return
Standards break down
Dashboards lose reliability
Build long-term data governance habits
Strong data governance includes:
Ownership rules
Standardized definitions
Validation processes
Regular audits
Long-term consistency creates long-term analytics success.
How Exology Helps
At Exology, we help businesses build reliable analytics foundations before dashboards and AI systems are deployed.
Our experience across 200+ projects, 150+ businesses, 20+ countries, and 10+ industries has shown that successful analytics starts with structured, clean, and connected data.
We help companies:
Connect data from ERPs, CRMs, spreadsheets, cloud platforms, and operational systems into one reporting environment
Clean and standardize fragmented business data for accurate reporting
Build automated ETL workflows that reduce manual reporting work
Create real-time dashboards with trusted KPIs and centralized visibility
Improve operational coordination by integrating data across departments
Train teams to understand, use, and trust analytics systems effectively
Read More
Contact us
Whether you have a request, a query, or want to work with us, use the form below to get in touch with our team.