
7 Signs Your Business Has Outgrown Excel and Needs Professional Data Analytics
Discover 7 signs your business has outgrown Excel. Learn how professional data analytics helps global companies move from manual reporting to automated growth.
DATA ANALYTICS
Key Points
The Excel Wall: Businesses eventually outgrow spreadsheets, leading to frequent crashes, slow performance, and costly manual errors.
Unified Visibility: Professional data analytics breaks down departmental silos to provide a "single version of the truth" for global operations.
Real-Time Speed: Automated reporting replaces slow, manual processes, allowing leaders to make decisions based on live data rather than old reports.
Fact-Based Growth: Data-driven companies are statistically more likely to acquire customers and increase profitability compared to those relying on intuition.
Scalable Technology: Modern tools like SQL databases and Power BI dashboards provide a robust foundation that grows alongside your business.
Resource Optimization: Transitioning to professional analytics ends "Admin Hell" by freeing talented employees from repetitive data entry tasks.
Actionable takeaway: Identify one critical business question you cannot answer in real-time today and launch a small pilot dashboard to automate that specific insight.
Every business starts with a simple goal. You want to track what you buy and what you sell. In the early days, a basic spreadsheet is the perfect tool for this. This is often called the "Excel Phase." It is a low-cost way to manage a small team and limited information. However, as your company grows, these manual tools quickly become a bottleneck.
Relying on spreadsheets for too long can lead to hidden costs and missed opportunities. If your team is spending more time fixing broken formulas than making sales, you are facing a data crisis. Moving to professional data analytics is not just an upgrade. it is a necessary step to ensure your business survives the move from a local startup to a global leader.
At Exology, we have seen this transition hundreds of times. We have worked on over 200+ projects for more than 150+ businesses across 20+ countries. Our team has helped companies in 10+ key industries move from the chaos of manual entry to the clarity of automated insights. We have seen first-hand how the right data strategy can turn a struggling department into a profit center.
What is data analytics for business?
Before we look at the warning signs, it is important to understand what data analytics actually does. It is not just about keeping records. It is the process of examining raw information to find patterns and answer specific questions. It turns a mountain of confusing numbers into a clear story about your business performance.
Professional analytics moves you beyond simply knowing what happened in the past. It helps you understand why it happened and what is likely to happen next. This clarity allows you to make decisions based on facts rather than just a feeling.
The technical foundation
To get the most out of your information, you need a solid technical setup. This usually starts with a secure database system like SQL Server or MySQL. These systems are built to store millions of rows of data without slowing down or crashing.
Once your data is stored safely, you use visualization programs like Power BI, Tableau, or Looker. These tools take complex numbers and turn them into easy-to-read charts and dashboards. This ensures that everyone in your company, from the CEO to the sales team, can understand the results at a glance.
Connecting your data sources
Most modern businesses use several different programs to run their operations. You might use Microsoft Dynamics or Oracle for finance. You might use SAP for supply chain management or Odoo for your warehouse.
Professional analytics acts as a bridge between these systems. By using platforms like Microsoft Fabric, you can combine data from all these sources into one central place. This gives you a "single version of the truth." It stops the common problem where different departments show different revenue numbers in meetings.
7 Signs You Need Professional Data Analytics
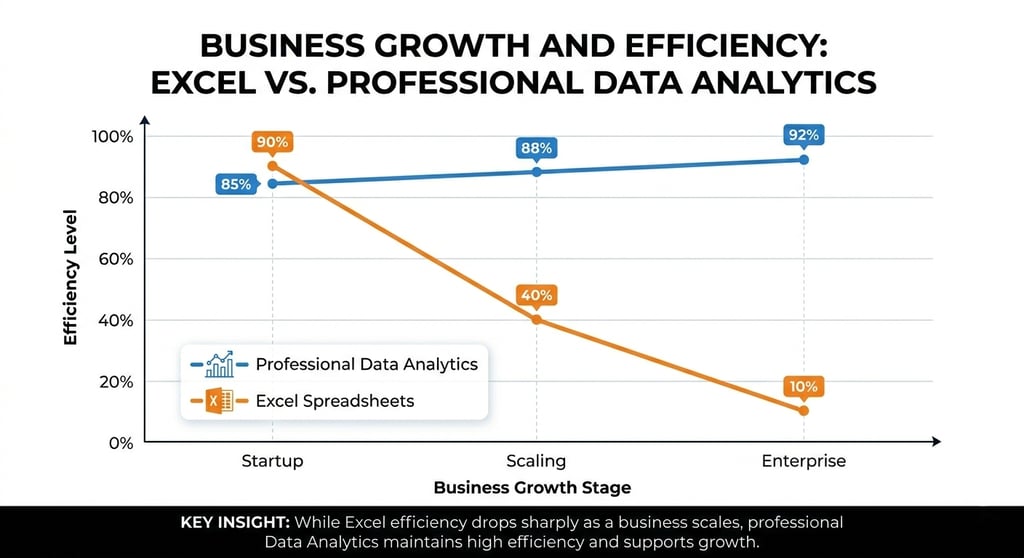
1. You have hit the "Excel Wall"
The first sign is usually a drop in performance. Your spreadsheets might take minutes to open. They might crash when you try to create a new report. This is because Excel was never meant to be a permanent database for a growing company.
When a file becomes too large, the risk of a "hidden error" grows. A single typo in a long formula can ruin an entire month of financial planning. According to research from IBM, poor data quality and manual errors cost organizations an average of $12.9 million per year. If your business handles a high volume of transactions, you have likely reached the limits of manual spreadsheets.
2. A total lack of visibility on performance
Can you see your total global revenue for the last hour with just one click? If you have to wait for several people to email you their files before you can see the big picture, you have a visibility problem. Many businesses operate with "blind spots" where they simply don't know which products or regions are the most profitable.
Without professional Business Intelligence, data stays trapped in different departments. This lack of visibility makes it impossible to spot problems early. By the time you see the numbers in a monthly report, it is often too late to fix the issue.
3. Your reporting process is too slow to be useful
In a fast-moving global market, timing is everything. If your team spends the first two weeks of every month preparing the previous month's report, you are always looking backward. Slow reporting means you are reacting to old problems instead of preventing new ones.
Professional analytics automates this entire process. It pulls data directly from your ERP systems in real-time. This allows your managers to see performance as it happens. Gartner predicts that by 2027, 50% of business decisions will be improved or even automated by AI and data systems. If you are still waiting weeks for a PDF report, you are already behind your competitors.
4. You are guessing your next major move
Experienced leaders often have good instincts. However, instincts alone are not enough to manage a complex global supply chain. If you feel uneasy about a major investment because you lack the facts to support it, your data strategy is failing you.
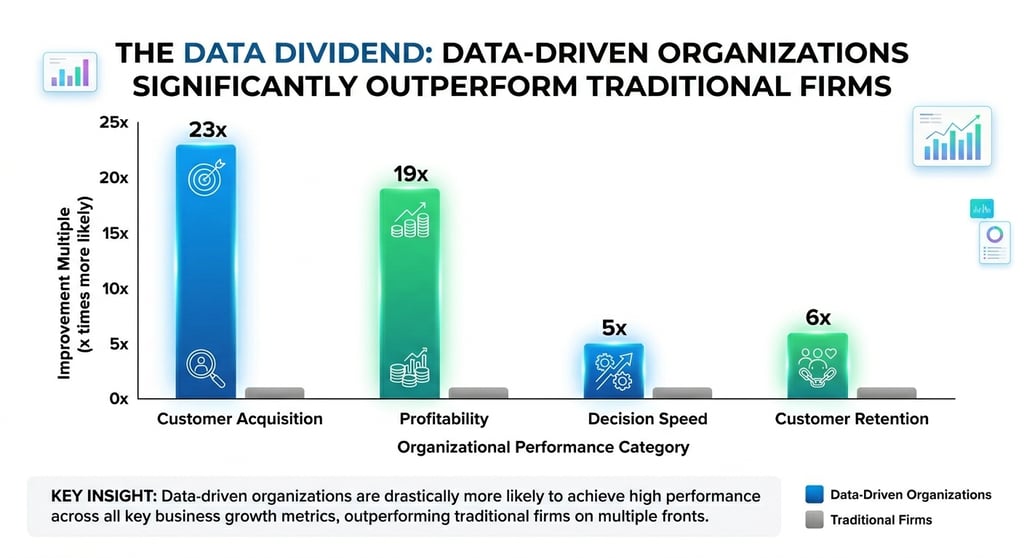
Data analytics provides the evidence you need to move forward with confidence. It allows you to see exactly which marketing campaigns drive the best results. It reveals which customers are the most loyal. According to McKinsey, data-driven organizations are 23 times more likely to acquire customers than those that rely on intuition.
5. Your team is stuck in "Admin Hell"
Are your most talented employees spending hours every week copying data from one system to another? This is a massive waste of human potential. When your people are busy cleaning spreadsheets, they are not spending time on strategy or growth.
Moving to a professional data system frees your team from these repetitive tasks. It allows them to focus on high-value work that actually moves the needle for your business. We have seen this shift save thousands of hours for our clients worldwide, allowing them to scale without adding more administrative staff.
6. Inconsistent numbers across departments
Have you ever been in a meeting where the sales team says they made a million dollars, but the finance team says it was only nine hundred thousand? This happens when data is fragmented across different tools.
Fragmented data leads to confusion and slow decision-making. Professional analytics creates a unified view of your entire organization. Whether you are looking at data from Microsoft Dynamics or SAP, everyone sees the same numbers. This builds trust within your team and ensures that everyone is working toward the same goals.
7. You are missing opportunities that others see
The volume of data generated worldwide is growing at an incredible rate. Experts estimate that by the end of 2025, the total volume of data will reach 175 zettabytes.
If you are not using professional tools to analyze this information, you are missing out on valuable market trends. Your competitors might be seeing shifts in customer behavior that you are ignoring. Using data analytics allows you to spot these gaps and move first. This first-mover advantage is often what determines who wins in a crowded market.
Common Misconceptions About Data Analytics
Many business owners hesitate to invest in analytics because of common myths. It is important to clear these up so you can make an informed choice.
"It is too expensive for my company"
Many people think you need a massive budget to start with data. This is no longer true. With cloud-based tools and subscription models, professional analytics is now accessible to businesses of all sizes. You can start with a single dashboard and grow your system as your company expands.
"We don't have enough data yet"
You do not need billions of rows of data to get value. Even a small amount of information can reveal patterns in your sales or operational costs. The goal is to start building a data-driven culture early. This ensures that as your data grows, your systems are already in place to handle it.
"It is too complex for our team"
This is a common worry, but modern tools like Power BI and Looker are designed to be user-friendly. You do not need to be a scientist to read a chart. A good data partner will also provide training and consulting to ensure your team feels confident using the new systems.
Where to Start: A Simple Roadmap
The transition from spreadsheets to professional analytics can feel like a big step. The best way to start is by following a clear plan.
Identify your biggest pain point. What is the one question you can't answer right now? Focus your first project on solving that specific problem.
Audit your data sources. Make a list of where your information currently lives. This might be in Odoo, Excel, or a custom sales tool.
Choose the right tools. Select a visualization program that fits your team's skills.
Build a small pilot. Don't try to change everything at once. Build one dashboard that provides clear value to one department.
Expand and automate. Once you see the benefits, you can connect more data sources and automate more of your reporting.
How Exology Helps
Exology is a global leader in turning information into a competitive advantage. We have worked on over 200+ projects for more than 150+ businesses across 20+ countries. Our expertise spans over 10+ key industries, helping companies move beyond the Excel phase and into high-performance growth.
We provide comprehensive services to solve your data challenges, including:
Business Intelligence & Data Visualizations: We design intuitive dashboards using Power BI, Tableau, and Looker to give you total visibility.
Data Analytics & AI: We use advanced modeling to find hidden insights and deploy custom AI agents to automate complex tasks.
ERP Integration: Our team connects your data to systems like Odoo, SAP, Oracle, and Microsoft Dynamics.
Training and Consulting: We provide professional guidance to ensure your team is ready to lead a data-driven organization.
Our results speak for themselves:
$130k Saved in One Day: We helped a client identify a massive operational leak through real-time analytics.
5,000+ Hours of Manual Work Saved: Our automation solutions freed up thousands of hours for our clients in 2025 alone.
2.5x Growth in 2025: We don't just provide data; we provide the strategy that drives significant revenue increases.
Whether you are in the middle of a difficult software development project or need help with Microsoft Fabric, we have the tools and experience to guide you.
Read More
Contact us
Whether you have a request, a query, or want to work with us, use the form below to get in touch with our team.