Why Modern Retailers Are Investing in Dashboards for Retail
Discover why modern retailers invest in dashboards for retail to turn data into insights, optimize operations, and drive growth with real-time data dashboards.
BUSINESS APPLICATIONSBUSINESS INTELLIGENCE
Key Points
Dashboards for retail consolidate data from multiple sources, giving retailers a clear, real-time view of key metrics like sales, inventory, and customer behavior.
Retailers face common challenges such as scattered data, slow reporting, and poor ROI from traditional analytics, which dashboards help address.
Real-time dashboards enable faster, smarter decision-making and allow retailers to respond quickly to market shifts and demand changes.
Dashboards improve inventory management, reduce overstock or stockouts, and enhance planning through predictive analytics and demand forecasting.
Retail dashboards provide customer insights, enabling personalized marketing, optimized product assortment, and increased sales.
Integration with multiple systems and interactive visualizations ensures transparency, operational efficiency, and consistent performance monitoring across stores or channels.
Actionable takeaway: Implement a customizable, real-time retail dashboard to consolidate data, optimize inventory, and make faster, data-driven decisions that boost sales and efficiency.
Introduction
In today’s retail landscape, data is more abundant than ever. Point of sale systems, e-commerce platforms, customer interactions, and supply chain data create huge volumes of information. Without the right tools, retail teams often struggle to turn this data into actionable insights. That is where dashboards for retail come in.
Dashboards offer a unified, clear, real-time view of key retail metrics. They help businesses make faster decisions, manage inventory smarter, and respond quickly to changing customer demands. That is why many modern retailers invest in retail analytics solutions.
In this article, we explore what drives that investment, the benefits of dashboards for retail, the features to look for, and how data insights can support growth.
What Are Dashboards for Retail?
Definition and Purpose of Retail Dashboards
Dashboards for retail are digital tools that gather data from multiple sources, including sales systems, inventory, customer behavior, and supply chain, and present them in a clear, visual format. Their purpose is to give retailers a single pane of glass view that helps track performance, spot trends, and make data-driven decisions.
Key Components and Metrics Tracked
Common metrics and dimensions tracked on retail dashboards include:
Sales trends (daily, weekly, monthly revenue, sales per store or channel)
Inventory levels (stock status, turnover rate, overstock or stockout alerts)
Customer behavior and purchasing patterns
Marketing performance and ROI
Supply chain performance and order fulfillment
Store or staff performance when relevant
These data points give retailers a live view of business health and help them respond quickly to issues or opportunities.
Why Are Dashboards Becoming Essential for Retailers?
The Shift Toward Data-Driven Decision Making
The global market for retail analytics, which underlies dashboards for retail, is growing rapidly. According to a 2023 report by Fortune Business Insights, the market was valued at USD 7.56 billion and is expected to reach USD 31.08 billion by 2032.
Other forecasts show similar growth. One report puts the market at USD 10.4 billion in 2024, with expectations to hit around USD 45.2 billion by 2033.
This growth reflects the rising demand for business intelligence for retail and real-time retail data insights as retailers adopt data-driven strategies globally.
Addressing Common Retail Challenges
Retailers face several recurring pain points including data scattered across multiple systems, slow reporting processes, and poor ROI from traditional analytics. Dashboards for retail address these challenges by consolidating data, automating reporting, and providing real-time visibility.
As the adoption of analytics grows, many retailers now prioritize real-time data to optimize inventory, manage demand fluctuations, and respond quickly to changes. (imarcgroup.com)
Benefits of Using Dashboards for Retail
Faster, Smarter Decision-Making
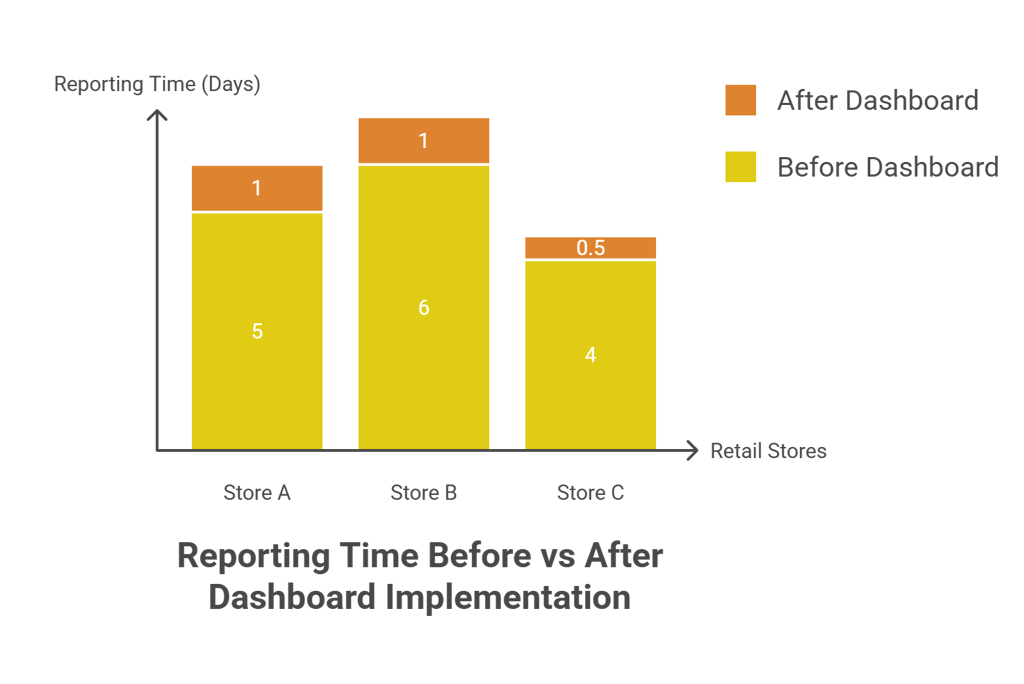
Retail dashboards drastically reduce the time needed to gather and interpret data. Instead of waiting hours or days for reports, managers can see up-to-date metrics with a click. This speed enables quick reaction to market shifts, promotions, or supply issues.
Improved Inventory and Stock Management
According to research, retailers using real-time analytics saw up to a 20 percent reduction in inventory costs and a 15 percent increase in order fulfillment rates.
Enhanced Customer Insights and Personalization
Dashboards for retail also help retailers understand customer behavior better. By tracking purchase patterns, product preferences, and buying frequency, businesses can tailor promotions, optimize product assortment, and personalize marketing.
This leads to better customer engagement and increased sales. Some retailers using BI and analytics report an 8.4 percent sales increase within the first year.
Tracking Performance Across Multiple Stores or Channels
For retailers operating multiple branches, online stores, or omnichannel operations, dashboards provide centralized visibility. They offer a unified view across locations and channels, enabling consistent performance monitoring, comparison, and benchmarking.
Dashboards help ensure transparency and control, especially for retail chains or businesses expanding into new markets.
Key Features to Look For in Dashboards for Retail
Real-Time Data Updates
Real-time data ensures that insights reflect the current state of your business. This is critical for inventory management, demand forecasting, and responding quickly to customer trends.
Customizable Metrics and KPIs
Every retailer has different priorities. Some care more about inventory turnover, others about customer behavior or marketing ROI. A good dashboard allows customization of metrics and KPIs to align with business goals.
Customizable dashboards give flexibility to track what matters most. This adaptability supports growth and changing business needs.
Interactive Visualizations and Reports
Visualizations, including charts, heat-maps, and graphs, make complex data understandable at a glance. Interactive dashboards let users drill down into details, such as sales by product, store, or period, without needing manual reporting.
This makes data insights more accessible to non-technical stakeholders such as store managers or marketing teams.
Integration With Existing Systems
Retailers often use multiple systems including POS, ERP, inventory management, and e-commerce platforms. A strong dashboard should integrate seamlessly with existing systems and consolidate data automatically.
This integration avoids data silos and ensures that analytics reflect all relevant business operations.
How Dashboards for Retail Support Business Growth
Increasing Operational Efficiency
By automating data collection and reporting, dashboards save time and reduce manual errors. Teams no longer need to compile spreadsheets from different systems. Instead, they get a live, unified view.
Improved efficiency frees up resources to focus on strategic tasks such as merchandising, marketing, and expansion rather than manual reporting.
Boosting Sales and Marketing ROI
With real-time sales data, customer behavior insights, and inventory trends, retailers can optimize pricing, promotions, and product placement. They can spot high-performing products, underperformers, and adjust strategies accordingly.
As mentioned, retailers leveraging BI solutions often see a measurable increase in sales volume in the first year.
Enabling Predictive Analytics and Forecasting
Dashboards are not just about historical or current data. When paired with analytics and AI, they support demand forecasting, trend prediction, and supply chain optimization.
How Exology Helps
Exology builds fully customized BI dashboards tailored to a retailer’s unique metrics including sales, inventory, and customer behavior, ensuring dashboards for retail that reflect what matters most to your business.
With Exology’s BIaaS offering, clients get ongoing access, updates, and support, ensuring dashboards stay accurate and relevant as business evolves.
Exology turns data scattered across systems into clear retail data insights, simplifying decision-making and reducing reporting delays.
Through data analytics and visualization, Exology helps retailers forecast demand, optimize stock, and align inventory with customer trends, boosting operational efficiency.
With digital transformation consulting and AI-enabled automation, Exology supports retailers in modernizing operations, improving agility and responsiveness.
Exology has successfully served clients in Egypt, across the MENA region, and internationally, bringing global expertise to every retail business it partners with.
Read More
Contact us
Whether you have a request, a query, or want to work with us, use the form below to get in touch with our team.