Why Power BI Is Considered the Best BI Tool
See why Power BI is considered the best BI tool, how it connects with Microsoft Fabric, Power Apps, and hundreds of data sources, and why teams choose it today.
BUSINESS INTELLIGENCE
Key Points
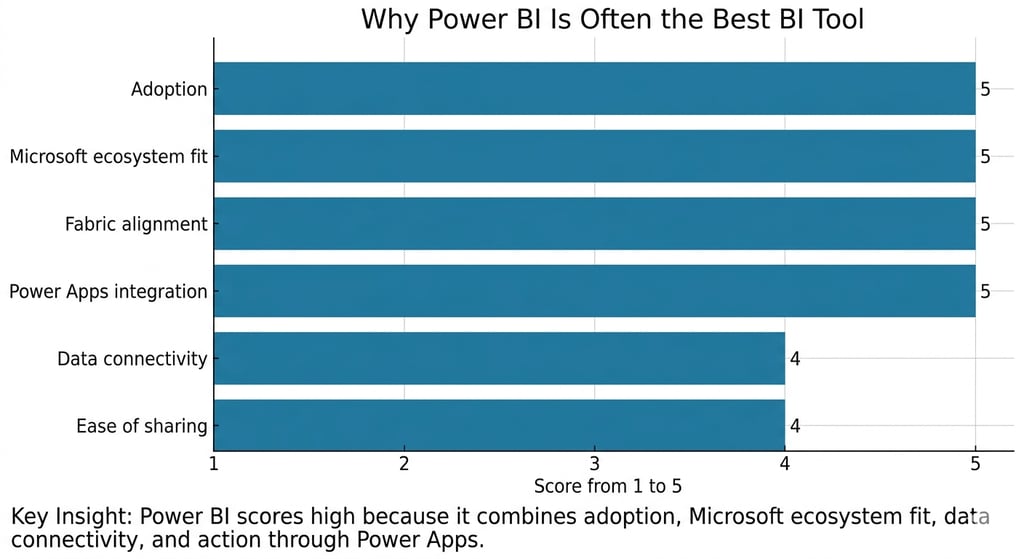
Power BI is considered one of the best BI tools because it combines reporting, analytics, sharing, and data modeling in one platform.
Power BI is widely trusted, with more than 30 million monthly active users across industries and business sizes.
The platform connects to hundreds of data sources, including ERPs, CRMs, spreadsheets, cloud apps, and SQL databases.
Power BI works closely with the Microsoft ecosystem, including Microsoft Fabric, Teams, Excel, SharePoint, and Power Apps.
Features like Power BI Desktop, Power BI Service, mobile access, and embedded analytics make it useful for both business users and technical teams.
Exology prefers Power BI because it helps businesses turn scattered data into clear, actionable decisions through practical reporting systems.
Actionable takeaway: Review your current reporting process and identify where Power BI can centralize data, automate reporting, and improve decision-making across teams.
What makes a BI tool “the best” for business?
The best BI tool is not just the one with the most features. It is the one that helps people connect data, understand it quickly, and use it to make better decisions.
That is why Power BI gets called the best by so many teams. It combines data modeling, dashboards, collaboration, and ecosystem fit in one platform. Microsoft describes Power BI as a unified, scalable platform for self-service and enterprise BI, and Microsoft Learn says it is a core part of Microsoft Fabric.
For most companies, the real question is not “Which BI tool has the most charts?” The real question is “Which BI tool helps people act faster, with less friction?” Power BI does that well because it fits both business users and technical teams.
Why Power BI is so widely used
30 million monthly active users matters
One of the strongest signals behind Power BI’s popularity is its scale. Microsoft said that 30 million monthly active users now rely on Power BI for insights. That number shows real-world adoption, not just marketing hype.
This matters because widely used tools usually have stronger community support, more learning resources, and a deeper talent pool. That reduces adoption risk for companies choosing a BI platform.
Adoption creates confidence
When many teams use the same BI platform, it becomes easier to hire, train, and support. It also becomes easier to find best practices, reusable templates, and experienced partners.
That is one reason Power BI is often seen as the safest BI choice for organizations that want both power and practicality. It is familiar to many users, but still strong enough for enterprise reporting.
What makes Power BI strong in daily business use?
It brings reporting, modeling, and sharing together
Power BI is more than a dashboard tool. It includes report creation, data modeling, sharing, and collaboration in one environment. Microsoft Learn explains that Power BI is used to connect to data sources, create interactive charts and dashboards, and share insights across an organization.
That matters because businesses do not only need visual reports. They need a workflow that takes them from raw data to a usable decision view.
It connects to hundreds of sources
Most companies work with more than one system. They use ERPs, CRMs, spreadsheets, cloud tools, SQL databases, and custom applications. Power BI handles this well because its connector framework supports data from hundreds of sources.
That flexibility is a major reason Power BI is so useful in real business environments. It helps teams centralize data without forcing them to rebuild everything from scratch.
It supports collaboration and governance
A BI tool becomes valuable when people actually use it across the business. Power BI supports that through sharing, workspaces, permissions, and organization-wide reporting. That makes it easier to build a single source of truth and keep everyone aligned on the same numbers.
How Power BI fits into the Microsoft ecosystem
Power BI and Microsoft Fabric
Power BI is not standing alone anymore. Microsoft says Power BI is a core component of Microsoft Fabric, and Fabric itself is described as a unified platform for data and analytics. In Fabric, Power BI shares features like data integration and security with the rest of the ecosystem.
That matters because businesses do not want disconnected tools. They want analytics, data preparation, governance, and reporting to work together. Power BI fits that model very well.
Power BI and Microsoft 365
Power BI also works naturally with Microsoft 365. Microsoft says users can access insights inside tools they already use, including Outlook, Teams, Excel, PowerPoint, and SharePoint.
This creates a big productivity advantage. Instead of sending screenshots or exporting static reports, teams can work with live data in the tools they already open every day.
Power BI and Power Apps
Power BI becomes even more useful when connected with Power Apps. Microsoft Learn says the Power Apps visual for Power BI lets users pass context-aware data into a canvas app, and the app updates in real time as the report changes.
That is powerful because it moves BI from passive reporting to active business action. A manager can see a problem in Power BI and trigger the next step in Power Apps without switching systems.
Which Power BI tools matter most?
Power BI Desktop
Power BI Desktop is where analysts build the report logic, data model, and visual layout. It is the main development environment for creating reports before publishing them to the service.
This is often the best place to clean data, create calculations, and define the structure of the dashboard.
Power BI Service
Power BI Service is where reports are published, shared, and used by the wider organization. It is the collaboration layer of the platform.
This is where teams manage access, monitor content, and keep dashboards in front of the right people.
Power BI Mobile
Mobile access matters more than many people think. Business leaders do not always sit at a desk when they need a KPI. Power BI’s mobile experience helps users review reports on the go, and Microsoft continues to update mobile capabilities regularly.
Power BI Embedded and gateways
Power BI Embedded is useful when a company wants to place reports inside its own application or customer portal. Data gateways help when source systems are on-premises or in mixed environments. Together, these features make Power BI flexible enough for both internal reporting and productized analytics.
Why Exology prefers Power BI
It helps teams make decisions, not just reports
At Exology, we prefer Power BI because it supports how businesses actually work. It is strong enough for serious analytics, but simple enough for business users to understand and use.
That fits our philosophy of transforming data into decisions. A dashboard should not just look good. It should help leaders see what is happening, understand why it matters, and act faster.
It fits our project experience
Exology has delivered 200+ projects for 150+ businesses across 20+ countries and 10+ key industries. That experience matters because it shows we have worked across different environments, different reporting needs, and different levels of data maturity.
In real projects, we have seen that many companies do not need a fancy tool. They need a system that connects their data, simplifies reporting, and gets used by the team every day. Power BI often fits that need extremely well.
It supports the way we build solutions
Power BI connects naturally with our broader work across analytics, smart applications, automation, and training. It can sit inside a decision engine, feed an operational app, or trigger a workflow.
That makes it useful not only for reporting, but also for building practical business systems around the report.
When Power BI is the right choice
Best use cases
Power BI is a strong choice when a business needs:
A single view of key metrics
Reporting across multiple systems
Dashboards that business teams can use without long training
Microsoft-based collaboration and sharing
A path from reporting into automation or apps
It is especially effective for companies that want to reduce manual reporting and build a more reliable source of truth.
When another tool may fit better
No BI tool is perfect for every case. Some organizations may need very specialized statistical features, deep niche visualization control, or a non-Microsoft stack from the start.
Even then, Power BI remains a strong benchmark because it gives a broad mix of capability, usability, and integration in one platform. Microsoft’s ongoing updates also show that it continues to evolve. The May 2026 Power BI update includes visual calculations and custom totals in general availability, plus new Copilot shortcuts and reporting improvements.
How Exology Helps
We help businesses design data capture systems that fit the real workflow, whether that means software forms, mobile apps, web apps, or connected business tools.
We build dashboards that track the KPIs that matter for each business model, so leaders see performance clearly instead of drowning in unused numbers.
We connect scattered systems into one trusted view, so teams stop arguing over different versions of the truth and start making decisions from the same data.
We turn analysis into action by building Decision Engines that show what is happening, why it is happening, and what leaders should do next.
We help companies move from manual reporting to faster, cleaner, and more reliable decision-making, backed by Exology’s experience across 200+ projects, 150+ businesses, 20+ countries, and 10+ key industries.
Read More
Contact us
Whether you have a request, a query, or want to work with us, use the form below to get in touch with our team.